Selection (iHS & nSL)
General Distribution
Distribution by population
Orange lines show the threshold for significant P-values, as specified in the FILTERS MENUFunctional Description
Variant Effect (SnpEff)
Regulome DB
ClinVar
GWAS Catalog
DisGeNET
Age Information
Favored Mutation (iSAFE)
General Distribution
Distribution by population
To reduce complexity, the plot only shows those positions reporting an iSAFE score higher than 0.05. To see it all, check the table.Orange lines show the threshold for significant P-values, as specified in the FILTERS MENU
Summary Report
DISPLAY OPTIONS
Options in this menu apply to this page only. In the plot, iSAFE scores (y-axis) are represented for all SNVs across the genomic region of interest (x-axis). Color represents the strongest SNpEFF functional effect of each variant, and size represents its combined iHS + nSL value. The rest of information is displayed when dragging the mouse arround the plot.
Filters:
Current Region
Region table
DISPLAY OPTIONS
Batch Download
Input a CSV file with one or more sets of coordinates to download PopHumanVar raw data.
Format of the input file: <chr>,<start>,<end>
Example: 2,109510927,109705828
Data for a total maximum of 50 Mbp can be downloaded at a time.
Raw files for all the chromosomes are available from here.
Upload your Data
Input a phased VCF file including genetic variants for a ≤2Mb region in one single population. In vcf files, if the two genotypes are separated by a pipe (e.g. 0|1) it means that they are phased; if they are separated by a slash (e.g. 0/1), they are unphased. If so, refer to any phasing tools to adress this - SHAPEIT, Eagle, Beagle, etc.
Make sure that the reference/alternative alleles match the ancestral/derived alleles respectively. Both selscan and iSAFE are 'dumb' with respect to ancestral/derived coding and simply assume that the reference allele (REF) is the ancestral allele. With previous knowledge of the ancestral alleles PLINK provides the tools to recode vcf.
In case of doubt, you can download a toy example here.
Once your VCF is uploaded and validated concerning the requirements above -it might take up to a minute-, an additional panel will appear. You will then be able to set different filters and computation parameters for the assorted analysis software. The ones selected by default are the ones that we used to generate PopHumanVar data. Please, make sure to read the manuals of both programs to make sure that the parameters and files are correct. The links will appear in the filtering panel below.
Make sure to enter a correct email address in the corresponding section. Results will be sent there when the pipeline process is complete (less than 3 days). You will get a Raw.txt.gz file with the computed data aside from a shiny markdown file representing a simplified version of PopHumanVar. If problems arise at any step of the pipeline, these will be reported to your email in the form of a log file.
Selscan Parameters (iHS & nSL)
Check selscan manual here.
iHS parameters
nSL parameters
iSAFE Parameters
Check iSAFE manual here.
iSAFE parameters
Gaps treatment:
Parameters Summary
Code
iHS parameters:
nSL parameters:
iSAFE parameters:
Email & Send
PopHumanVar
An Interactive App for the Functional Characterization and Prioritization of Genomic Variants
- What is PopHumanVar?
- Genomics data: the 1000 Genomes Project, phase 3
- Selection statistics
- Integrative haplotype score (iHS)
- Number of segregating sites by length (nSL)
- Integrated Selection of Allele Favored by Evolution (iSAFE)
- Functional annotations
- Age information
- Region of interest
- Characterization of the region with PopHumanVar
- Navigate to the region of interest
- Select one or more populations
- Explore the region and its genetic variants
- Downloading raw data
Section 1 | Description and contents of PopHumanVar
1. What is PopHumanVar?
PopHumanVar is an interactive online application that is designed to facilitate the exploration and thorough analysis of candidate genomic regions under selection, generating useful summary reports of prioritized variants that are putatively causal of recent selective sweeps.
It compiles and graphically represents selection statistics based on linkage disequilibrium, a comprehensive set of functional annotations, and recent genealogical estimations of variant age for single nucleotide variants (SNVs) of all populations of the phase 3 of the 1000 Genomes Project (1000GP). Specifically, PopHumanVar amasses data either computed or compiled from the following data sources: the integrative haplotype score (iHS), the number of segregating sites by length (nSL), the integrated selection of allele favored by evolution (iSAFE), SnpEFF, RegulomeDB, ClinVar, GWAS Catalogue, DisGeNET and GEVA (Human Genome Dating).
As such, PopHumanVar is complementary to our previous genome browser PopHuman (https://pophuman.uab.cat) and database of candidate selection regions PopHumanScan (https://pophumanscan.uab.cat), allowing researchers to focus on particular selective sweeps, pinpoint the corresponding causal variants, and estimate allele age (Figure 1).
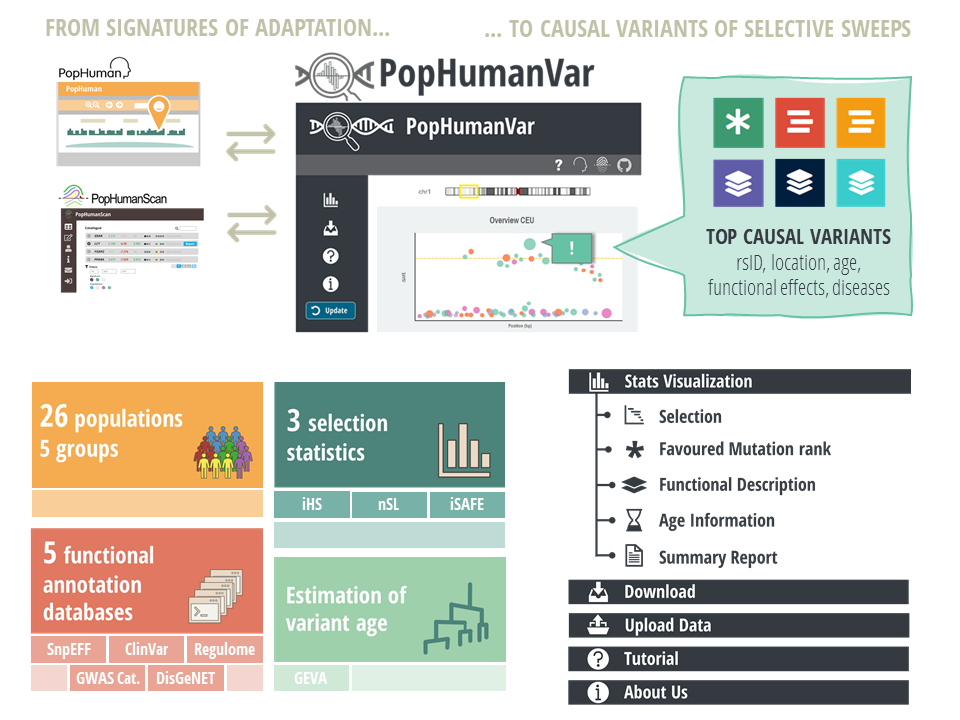
Figure 1 | Graphical abstract.
2. Genomics data: the 1000 Genomes Project, phase 3
The 1000 Genomes Project[1] (1000GP) set out to provide one of the most comprehensive descriptions of human genetic variation by applying whole-genome sequencing to a diverse set of individuals from several populations around the world. In its final phase (phase 3), the consortium published the reconstruction of the genomes of 2,504 individuals from 26 populations using a combination of low-coverage whole-genome sequencing, deep exome sequencing, and dense microarray genotyping (The 1000 Genomes Project Consortium 2015; Figure 2). With 84.7 million single nucleotide polymorphisms (SNPs), the resource is estimated to include >99% of SNP variants with a frequency of >1% for a variety of ancestries.
3. Selection statistics
PopHumanVar represents three different population metrics, computed genome-wide for each population:
- Integrative haplotype score (iHS)[2]: It is an haplotype-based statistic that tracks the decay of haplotype homozygosity for both ancestral and derived haplotypes. It has good power to detect selective sweeps at a moderate frequency (50%–80%).
- Number of segregating sites by length (nSL):[3]: It is also an haplotype-based statistic. It combines information on the distribution of fragment lengths, defined by pairwise differences, with the distribution of the number of segregating sites between all pairs of chromosomes. It is better at capturing soft sweeps than iHS.
- Integrated Selection of Allele Favored by Evolution (iSAFE):[4]: It exploits coalescent-based signals in the 'shoulders' of the selective sweep (i.e., genomic regions proximal to the region under selection that still carry the selection signal) to rank all mutations based on their contribution to the selection signal.
Methodological details: All selection statistics were computed on the 22 non-admixed populations of the phase 3 of the 1000GP, including non-inbred individuals as specified by Gazal et al.[5]. We analyzed autosomal biallelic SNVs present in the 1000GP pilot accessibility mask. To compute iHS and nSL we used selscan v1.2.0a together with norm v1.2.1a[6]. In the case of iHS, we used the sex-averaged recombination map from Bhérer et al. (2017)[7]. To compute iSAFE, we analyzed overlapping sliding windows of 3 Mbp, with a 1 Mbp overlap, all along the autosomal chromosomes. From each window, we kept values for the 1 Mbp middle chunk and discarded values in the shoulders. In order to facilitate the genome-wide approach, we ran iSAFE with default parameters, but ignoring the gaps and increasing the maximum rank parameter up to the window size (MaxRank = window = 300) in order to retrieve values for all SNVs in the window.
4. Functional annotations
Variants are further characterized with functional annotations extracted from the following publicly available databases:
Snpeff
SnpEFF predicts and annotates the functional effects of genetic variants[8]. Effects are classified into four different categories based on their impact:
- High:splice donor variant, splice acceptor variant, stop gained, frameshift variant, stop lost, start lost, bidirectional gene fusion
- Moderate:disruptive inframe insertion, conservative inframe insertion, disruptive inframe deletion, conservative inframe deletion, missense variant
- Low:splice region variant, start retained variant, stop retained variant, synonymous variant, 5-utr premature start codon gain variant, initiator codon variant
- Modifiers:5-utr variant, 3-utr variant, intron variant, non-coding transcript exon variant, non-coding transcript variant, upstream gene variant, downstream gene variant, intragenic variant, intergenic region
RegulomeDB
RegulomeDB (v.2.0.3) predicts and annotates the regulatory effects of intergenic variants[9]. Evidence is compiled from GEO, ENCODE, and the published literature, and it includes known as well as predicted regulatory DNA elements, such as regions of DNase hypersensitivity sites, transcription factor binding sites, and promoter regions that have been biochemically characterized to regulate transcription. Evidence is categorized into the following scoring scheme:
- 1a → eQTL + TF binding + matched TF motif + matched DNase Footprint + DNase peak
- 1b → eQTL + TF binding + any motif + DNase Footprint + DNase peak
- 1c → eQTL + TF binding + matched TF motif + DNase peak
- 1d → eQTL + TF binding + any motif + DNase peak
- 1e → eQTL + TF binding + matched TF motif
- 1f → eQTL + TF binding / DNase peak
- 2a → TF binding + matched TF motif + matched DNase Footprint + DNase peak
- 2b → TF binding + any motif + DNase Footprint + DNase peak
- 2c → TF binding + matched TF motif + DNase peak
- 3a → TF binding + any motif + DNase peak
- 3b → TF binding + matched TF motif
- 4 → TF binding + DNase peak
- 5 → TF binding or DNase peak
- 6 → Motif hit
- 7 → Other
ClinVar
ClinVar (updated on 2021/03/04) is one of the largest catalogs of clinically-associated genetic variants[10]. It is a freely accessible, public archive of reports that cover relationships among medically-relevant variants and phenotypes, with supporting evidence. It rates the clinical significance of variant-disease associations into the following categories:
- Benign
- Likely benign
- Uncertain significance
- Likely pathogenic
- Pathogenic
- Drug response
- Association
- Risk factor
- Protective
- Affects
- Conflicting data from submitters
- Other
- Not provided
GWAS Catalog
The GWAS Catalog (v1.0.2) is a quality-controlled, manually-curated, literature-derived collection of published genome-wide association studies assaying at least 100,000 genetic variants[11]. PopHumanVar compiles the number of associations in the GWAS Catalog for each variant, as well as the specific traits reported.
DisGeNET
DisGeNET (v.7.0) is a platform containing one of the largest publicly-available collections of genes and variants associated with human diseases[12]. It integrates data from expert-curated repositories, homogeneously annotated with controlled vocabularies and community-driven ontologies. It provides several original metrics to assist the prioritization of genotype-phenotype relationships, such as the disease specificity of a given variant, or the evidence index.
Age information
Atlas of Variant Age
The Atlas of Variant Age is a publicly-available online database that contains age estimation for more than 45 million variants in the human genome[13]. Ages have been estimated using the Genealogical Estimation of Variant Age (GEVA), a method that involves coalescent modeling to infer the time to the most recent common ancestor (TMRCA) between individual genomes.
Section 2| Tutorial: PopHumanVar with an example: selection at the EDAR gene locus
1. Region of interest
In this tutorial, we will focus on a genomic region of 1.15Mb in chromosome 2(chr2:109500927..109615828).The region contains the gene EDAR —Ectodysplasin A Receptor— a cell-surface receptor that, upon binding to its ligand, induces an intracellular cascade leading to the activation of the transcription factor NF-кB [14].
EDAR is a well-studied gene. It is involved in the development of hair follicles, teeth, and sweat glands. It has frequently been reported in numerous genome-wide scans for positive selection in humans and is one of the candidate regions cataloged in PopHumanScan[15] (Figure 3). It shows signatures of selection for haplotype-based statistics (i.e., iHS and XP-EHH) in East-Asian populations, with the highest iHS value found in the Southern Han Chinese (CHS) population.
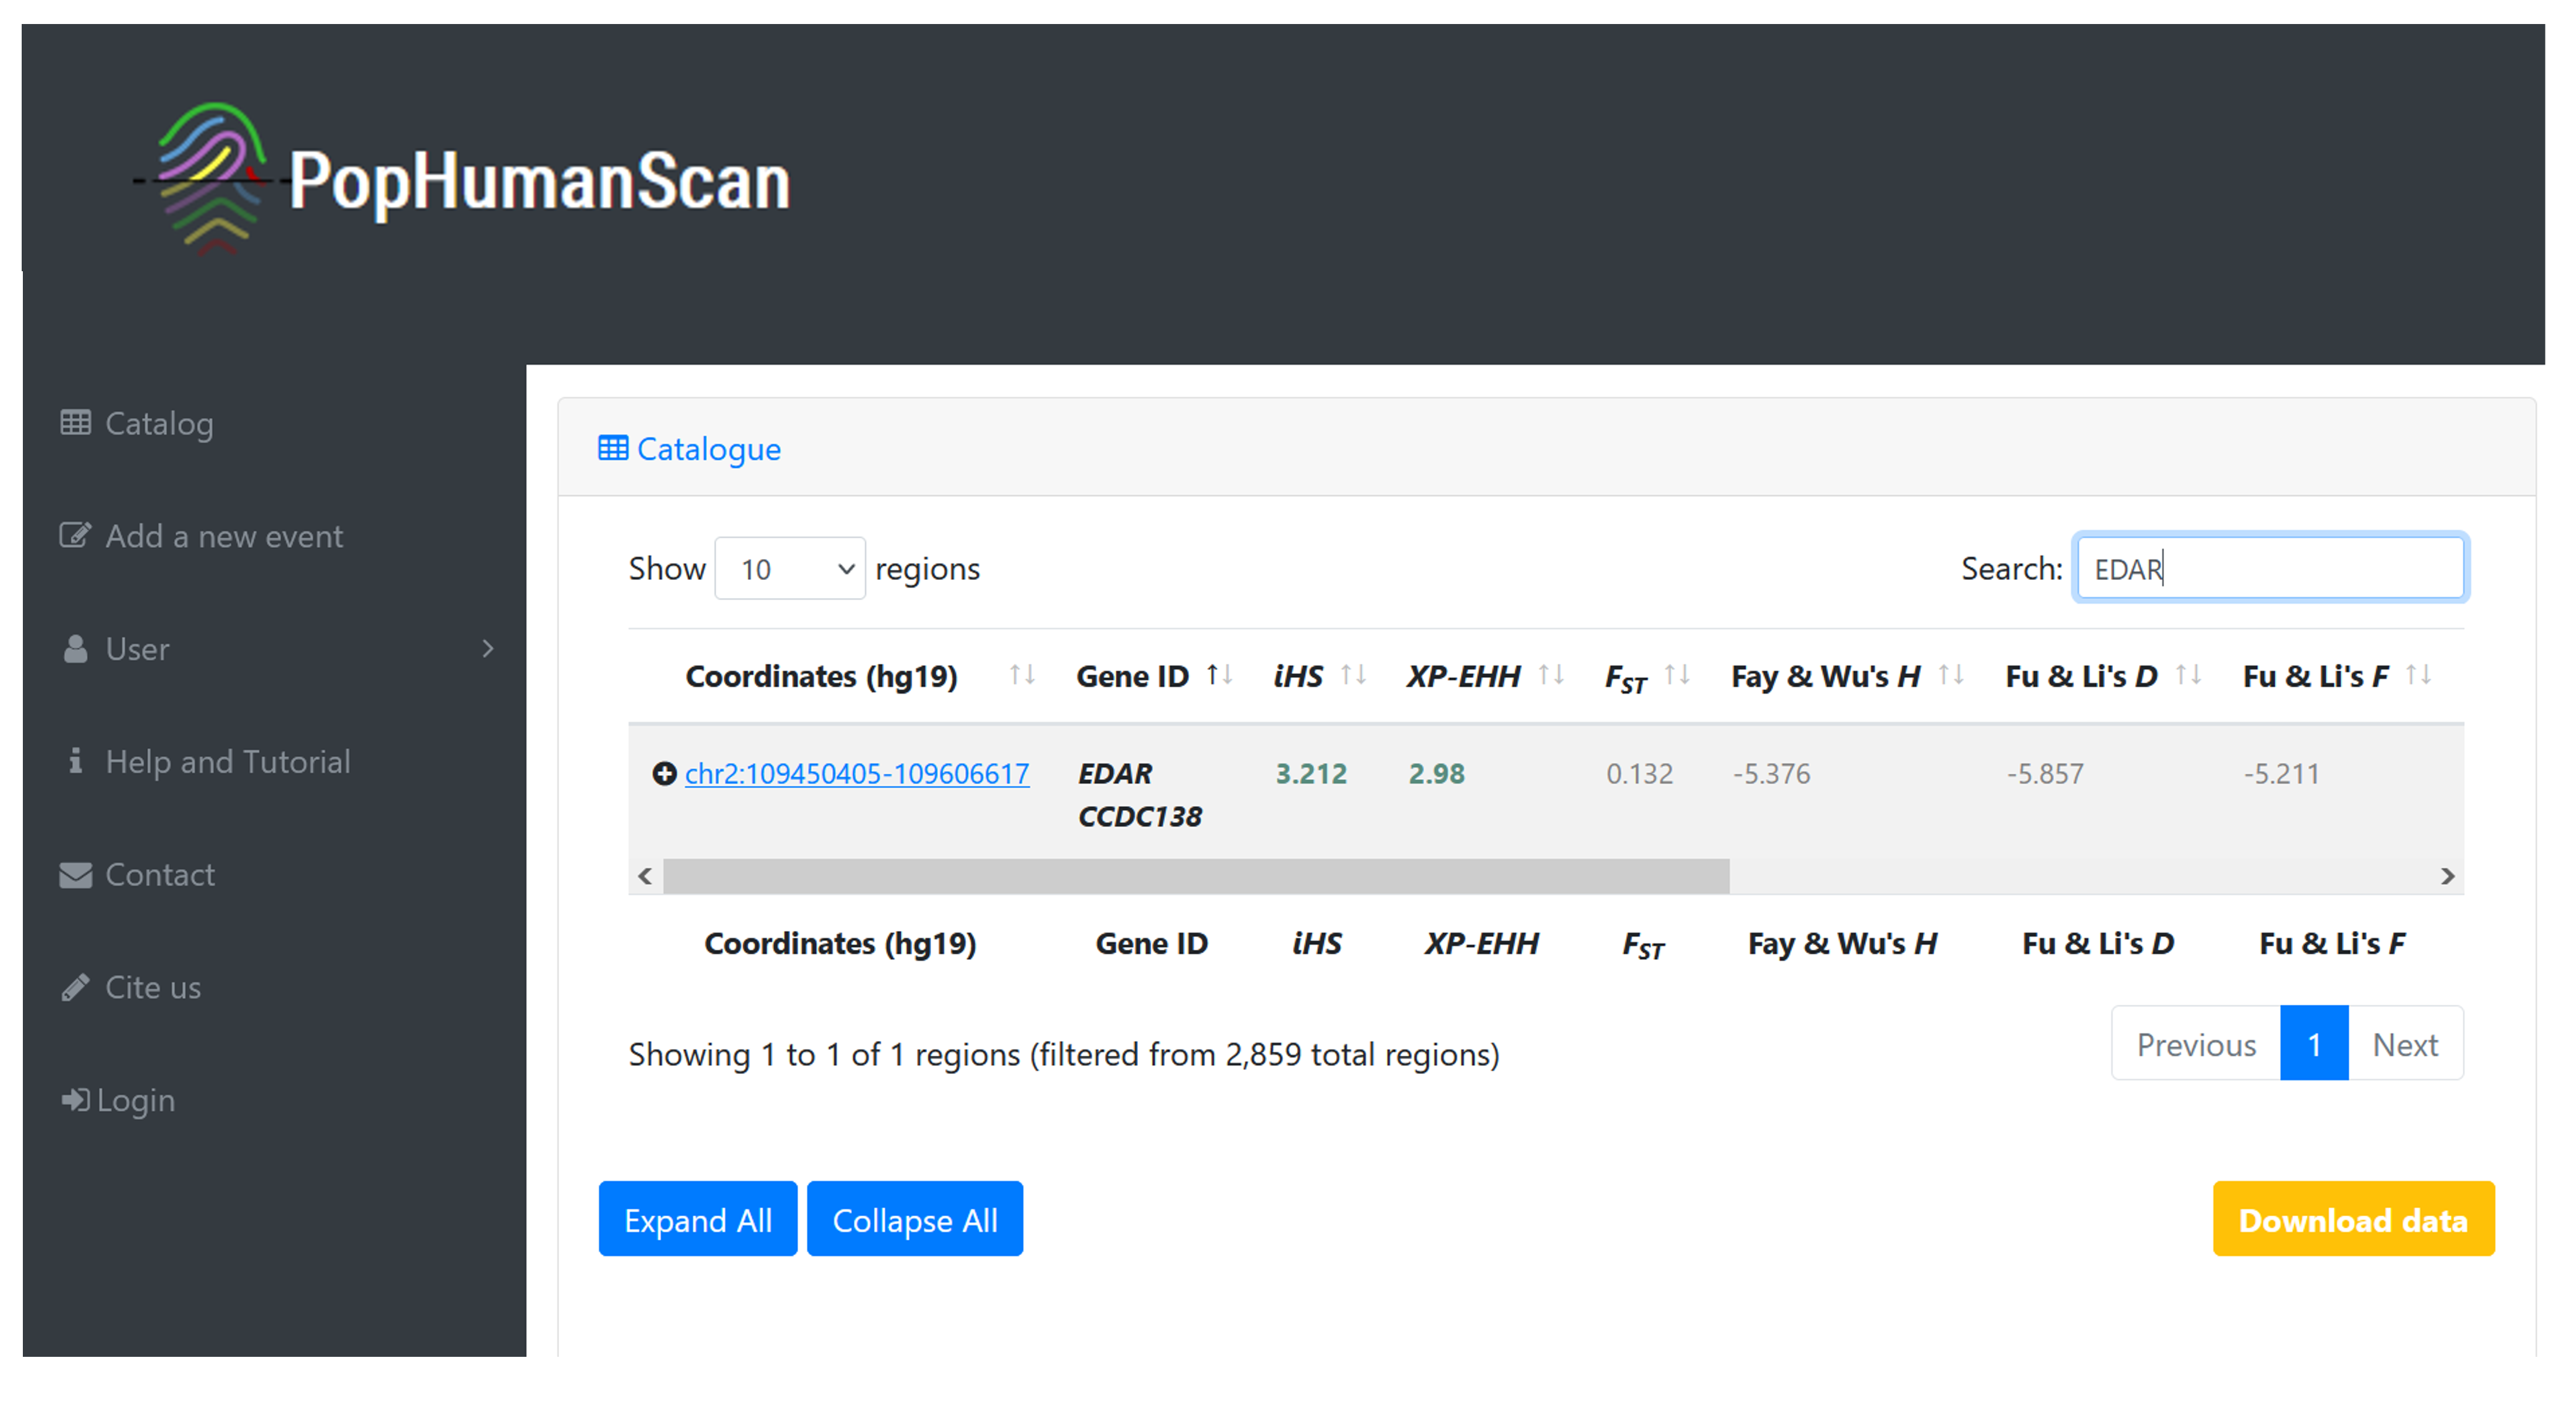
Figure 3 | Summary report of the EDAR candidate region in PopHumanScan. Direct link to the database here.
In addition, the region shows extreme values (i.e., more than two standard deviations away from the mean value) for the haplotype-based statistic iHS, and the Site Frequency Spectrum (SFS)-based statistics Tajima’s D, Fu and Li’s F and D, and Fay and Wu's H, as displayed in PopHuman[16] (Figure 4).
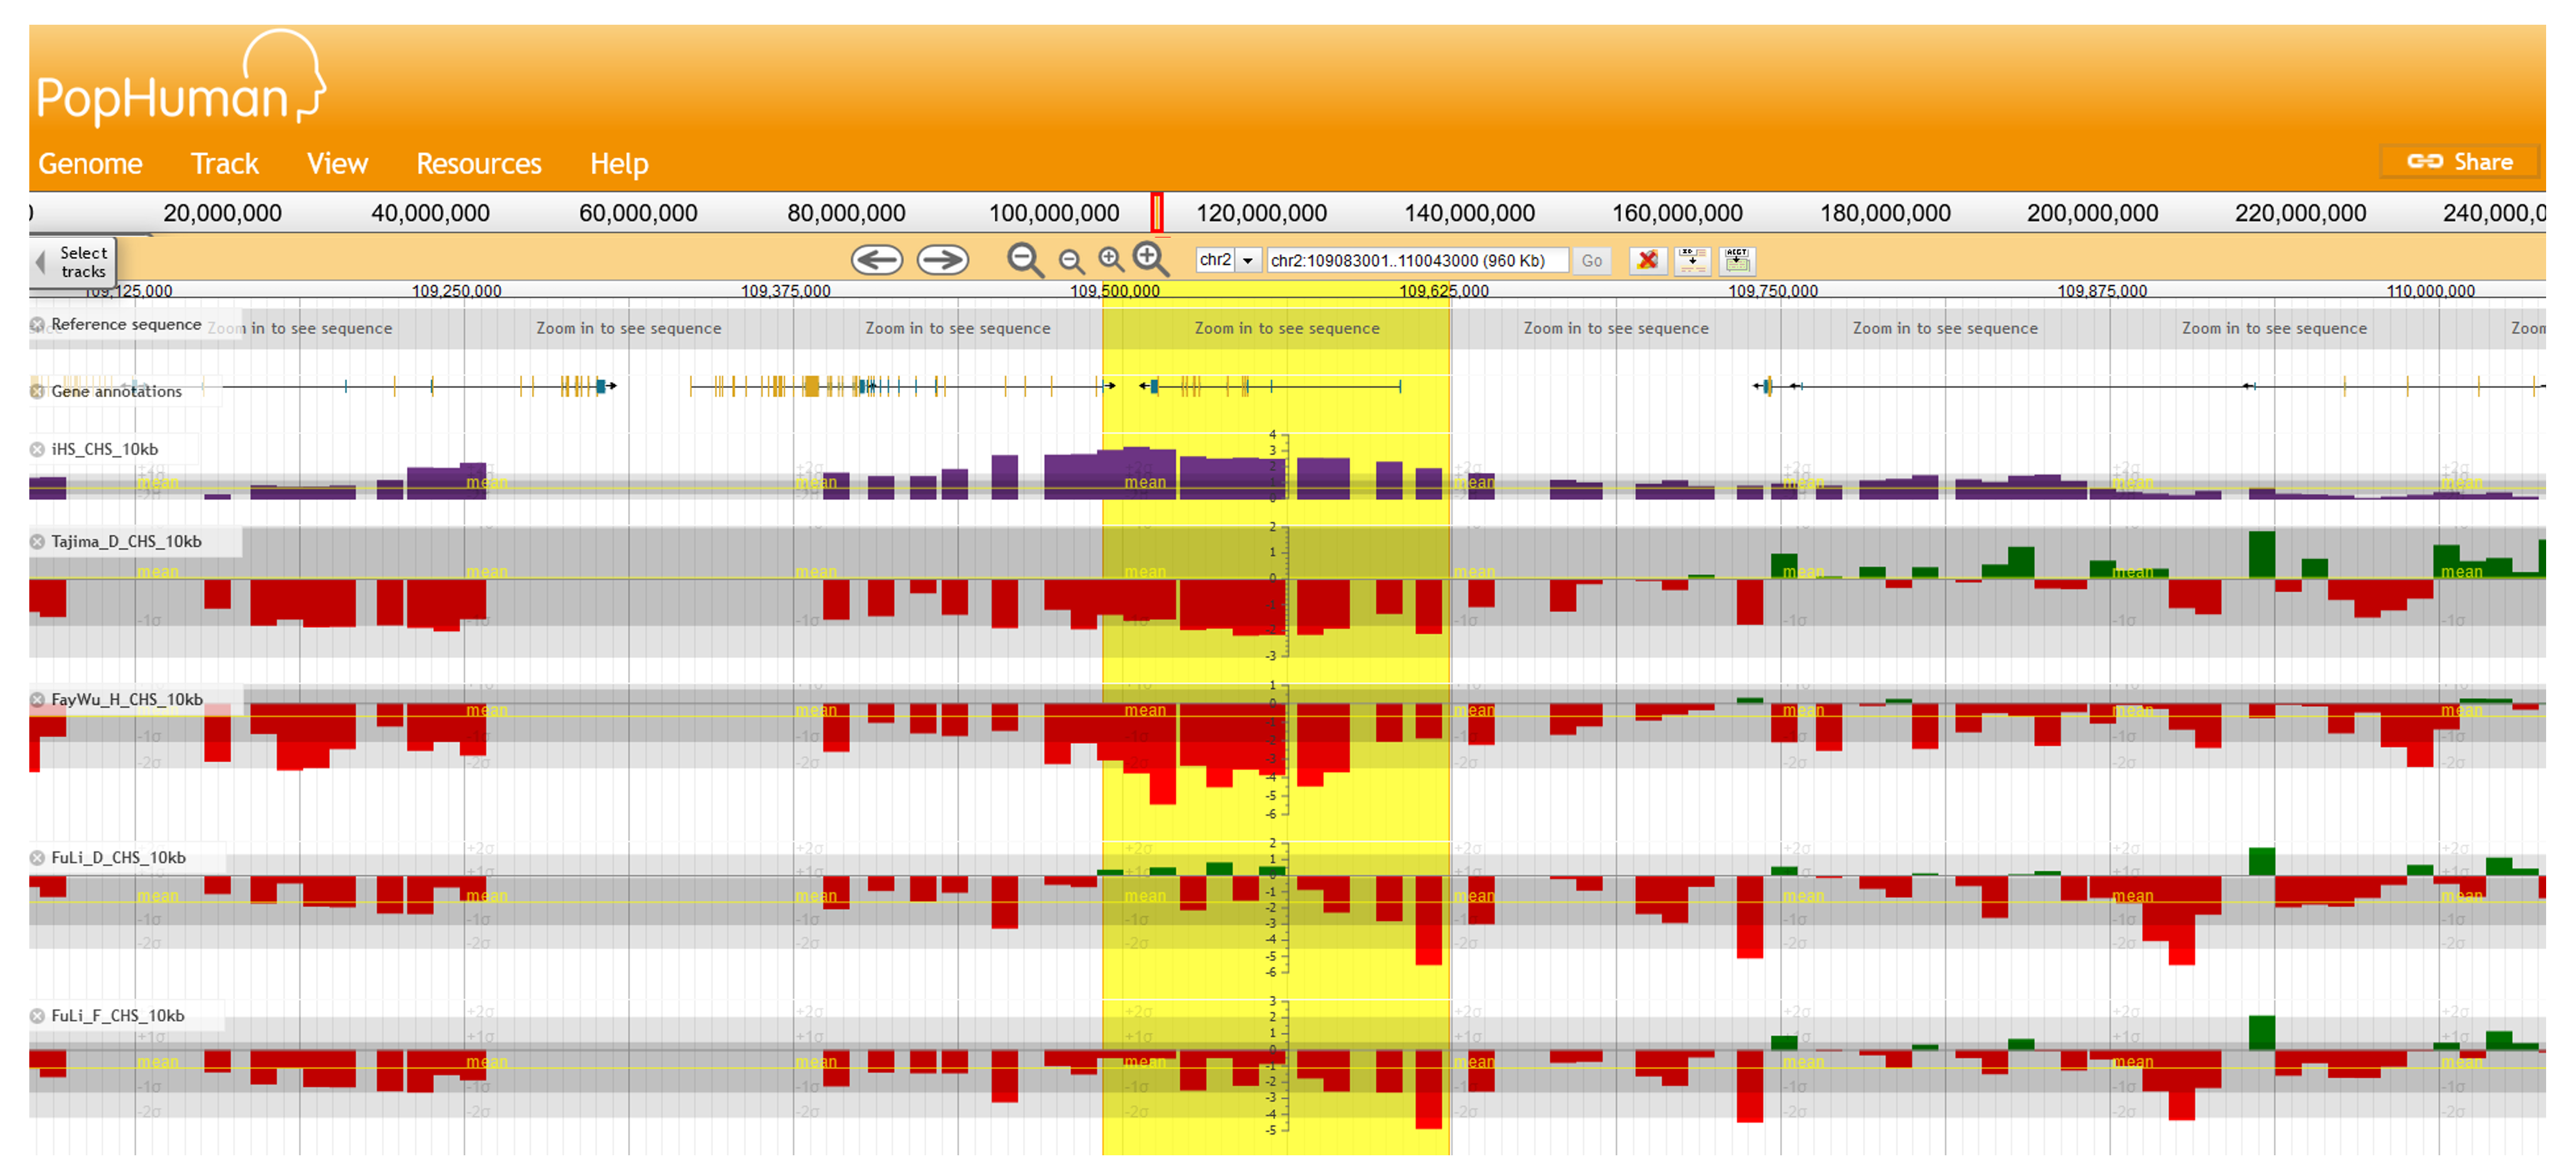
Figure 4 | Visualization of the EDAR candidate region in PopHuman. Direct link to the genomic browser here.
2. Characterization of the region with PopHumanVar
Navigate to the region of interest
Open PopHumanVar at https://pophumanvar.uab.cat. Find the section FILTERS MENU→ Coordinates on the left-side menu. To navigate to the target region, either type its coordinates (i.e., Chromosome: 2; Start Position:109500927; End Position: 109615828), or use the “Quick search” blue button to open a search dialogue and type the symbol of the gene in the search bar (i.e., Enter an ID: EDAR). Remember to press the Update button to apply filters.
Select one or more populations
In which populations are you interested? In this tutorial, we will focus on the Southern Han Chinese (CHS) population, which showed the most significant signatures in PopHumanScan (see section 1. Region of interest). We will also include other populations for comparison.
Find the section FILTERS MENU→ Populations on the left-side menu. Select CHS and at least one population from each of the other metapopulations (e.g., BEB —South Asia—, CEU —Europe—, and YRI —Africa—). Remember to press the Update button to apply filters.
Explore the region and its genetic variants
Information in PopHumanVar is distributed into several tabs, all accessible from the left-side menu:
- Stats Visualization→ Selection (iHS & nSL)
- Stats Visualization→ Favored Mutation (iSAFE)
- Stats Visualization→ Functional Description
- Stats Visualization→ Age Information
- Stats Visualization→ Summary Report
Stats Visualization→ Selection (iHS & nSL)
The first tab Stats Visualization→ Selection (iHS & nSL)— represents the general distributions of iHS and nSL values in each of the selected populations. In the current region of interest, East-Asian populations (green; including CHS) show a wider distribution and higher mean values of iHS and nSL than other metapopulations (Figure 5).
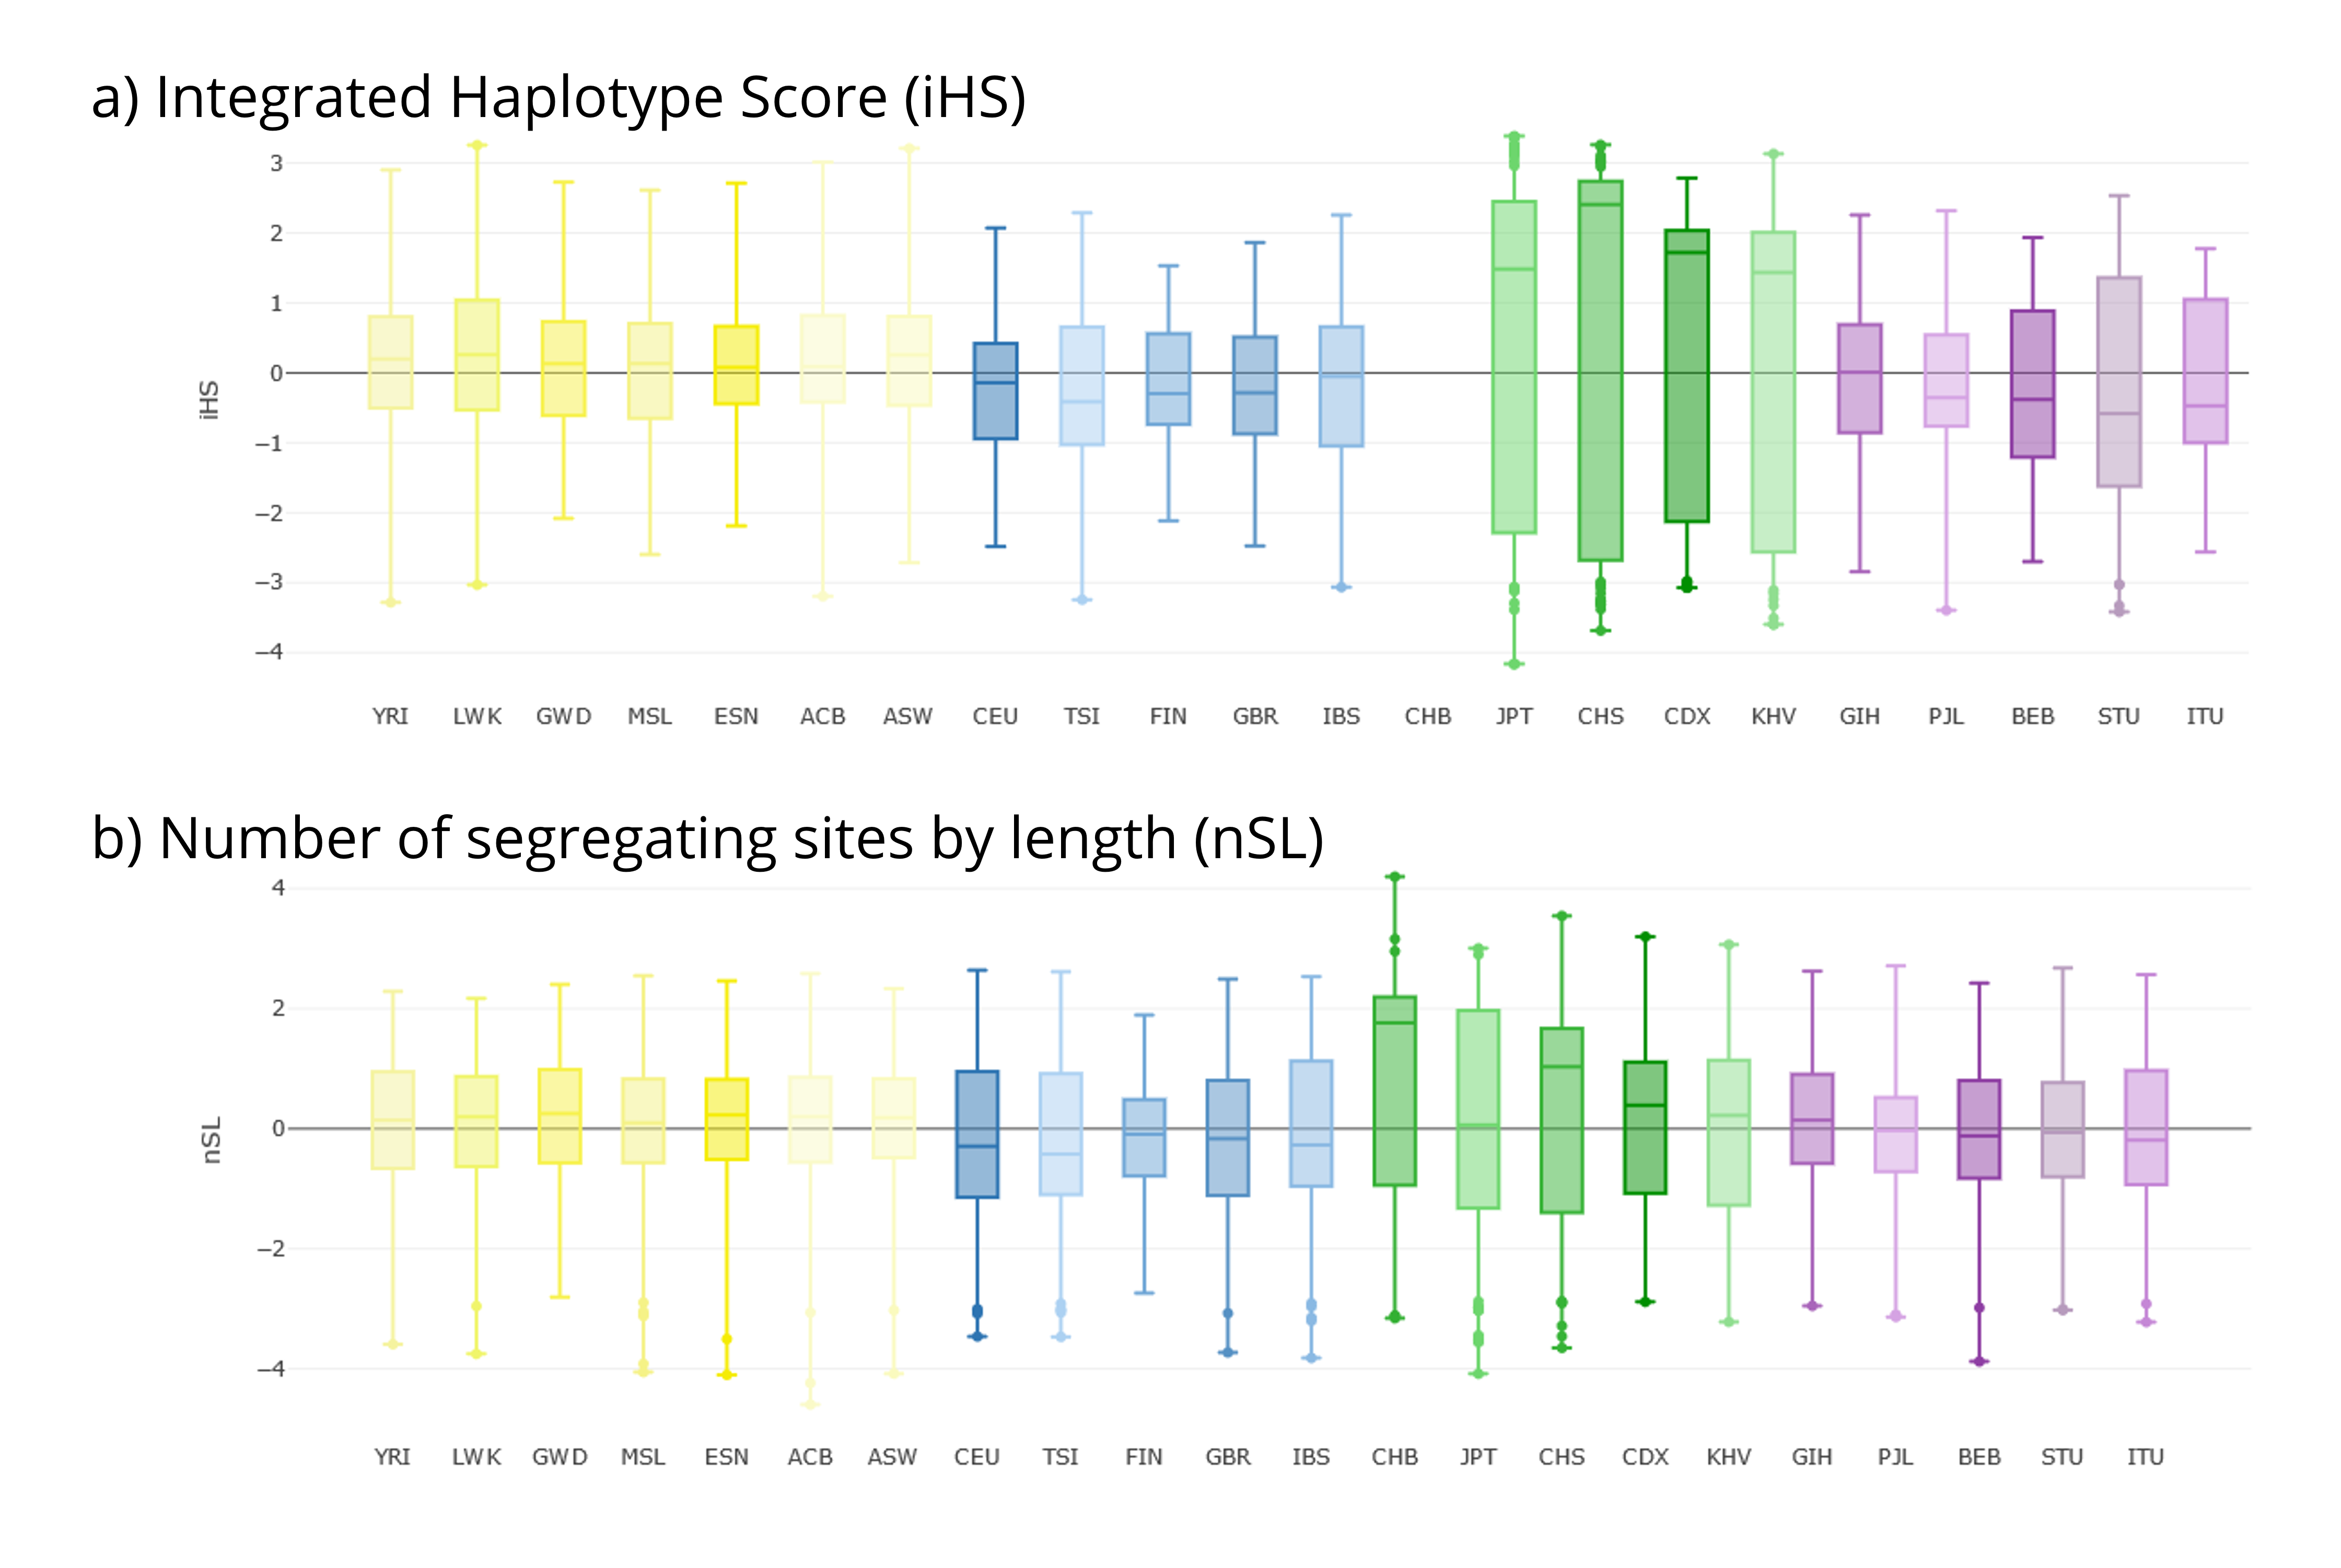
Figure 5 | Selection statistics for the EDAR gene region as shown in PopHumanVar. (a) iHS. (b) nSL
Below the general distributions of iHS and nSL, the values of these two statistics are represented for all genetic variants along the region of interest. Variants with extreme values (i.e., top 0.5%) of either iHS and/or nSL can be highlighted from the FILTERS MENU→ Selection on the left-side menu (remember to press the Update button to apply filters). In the current region of interest, extreme iHS values are almost exclusive to East-Asians (Figure 6).
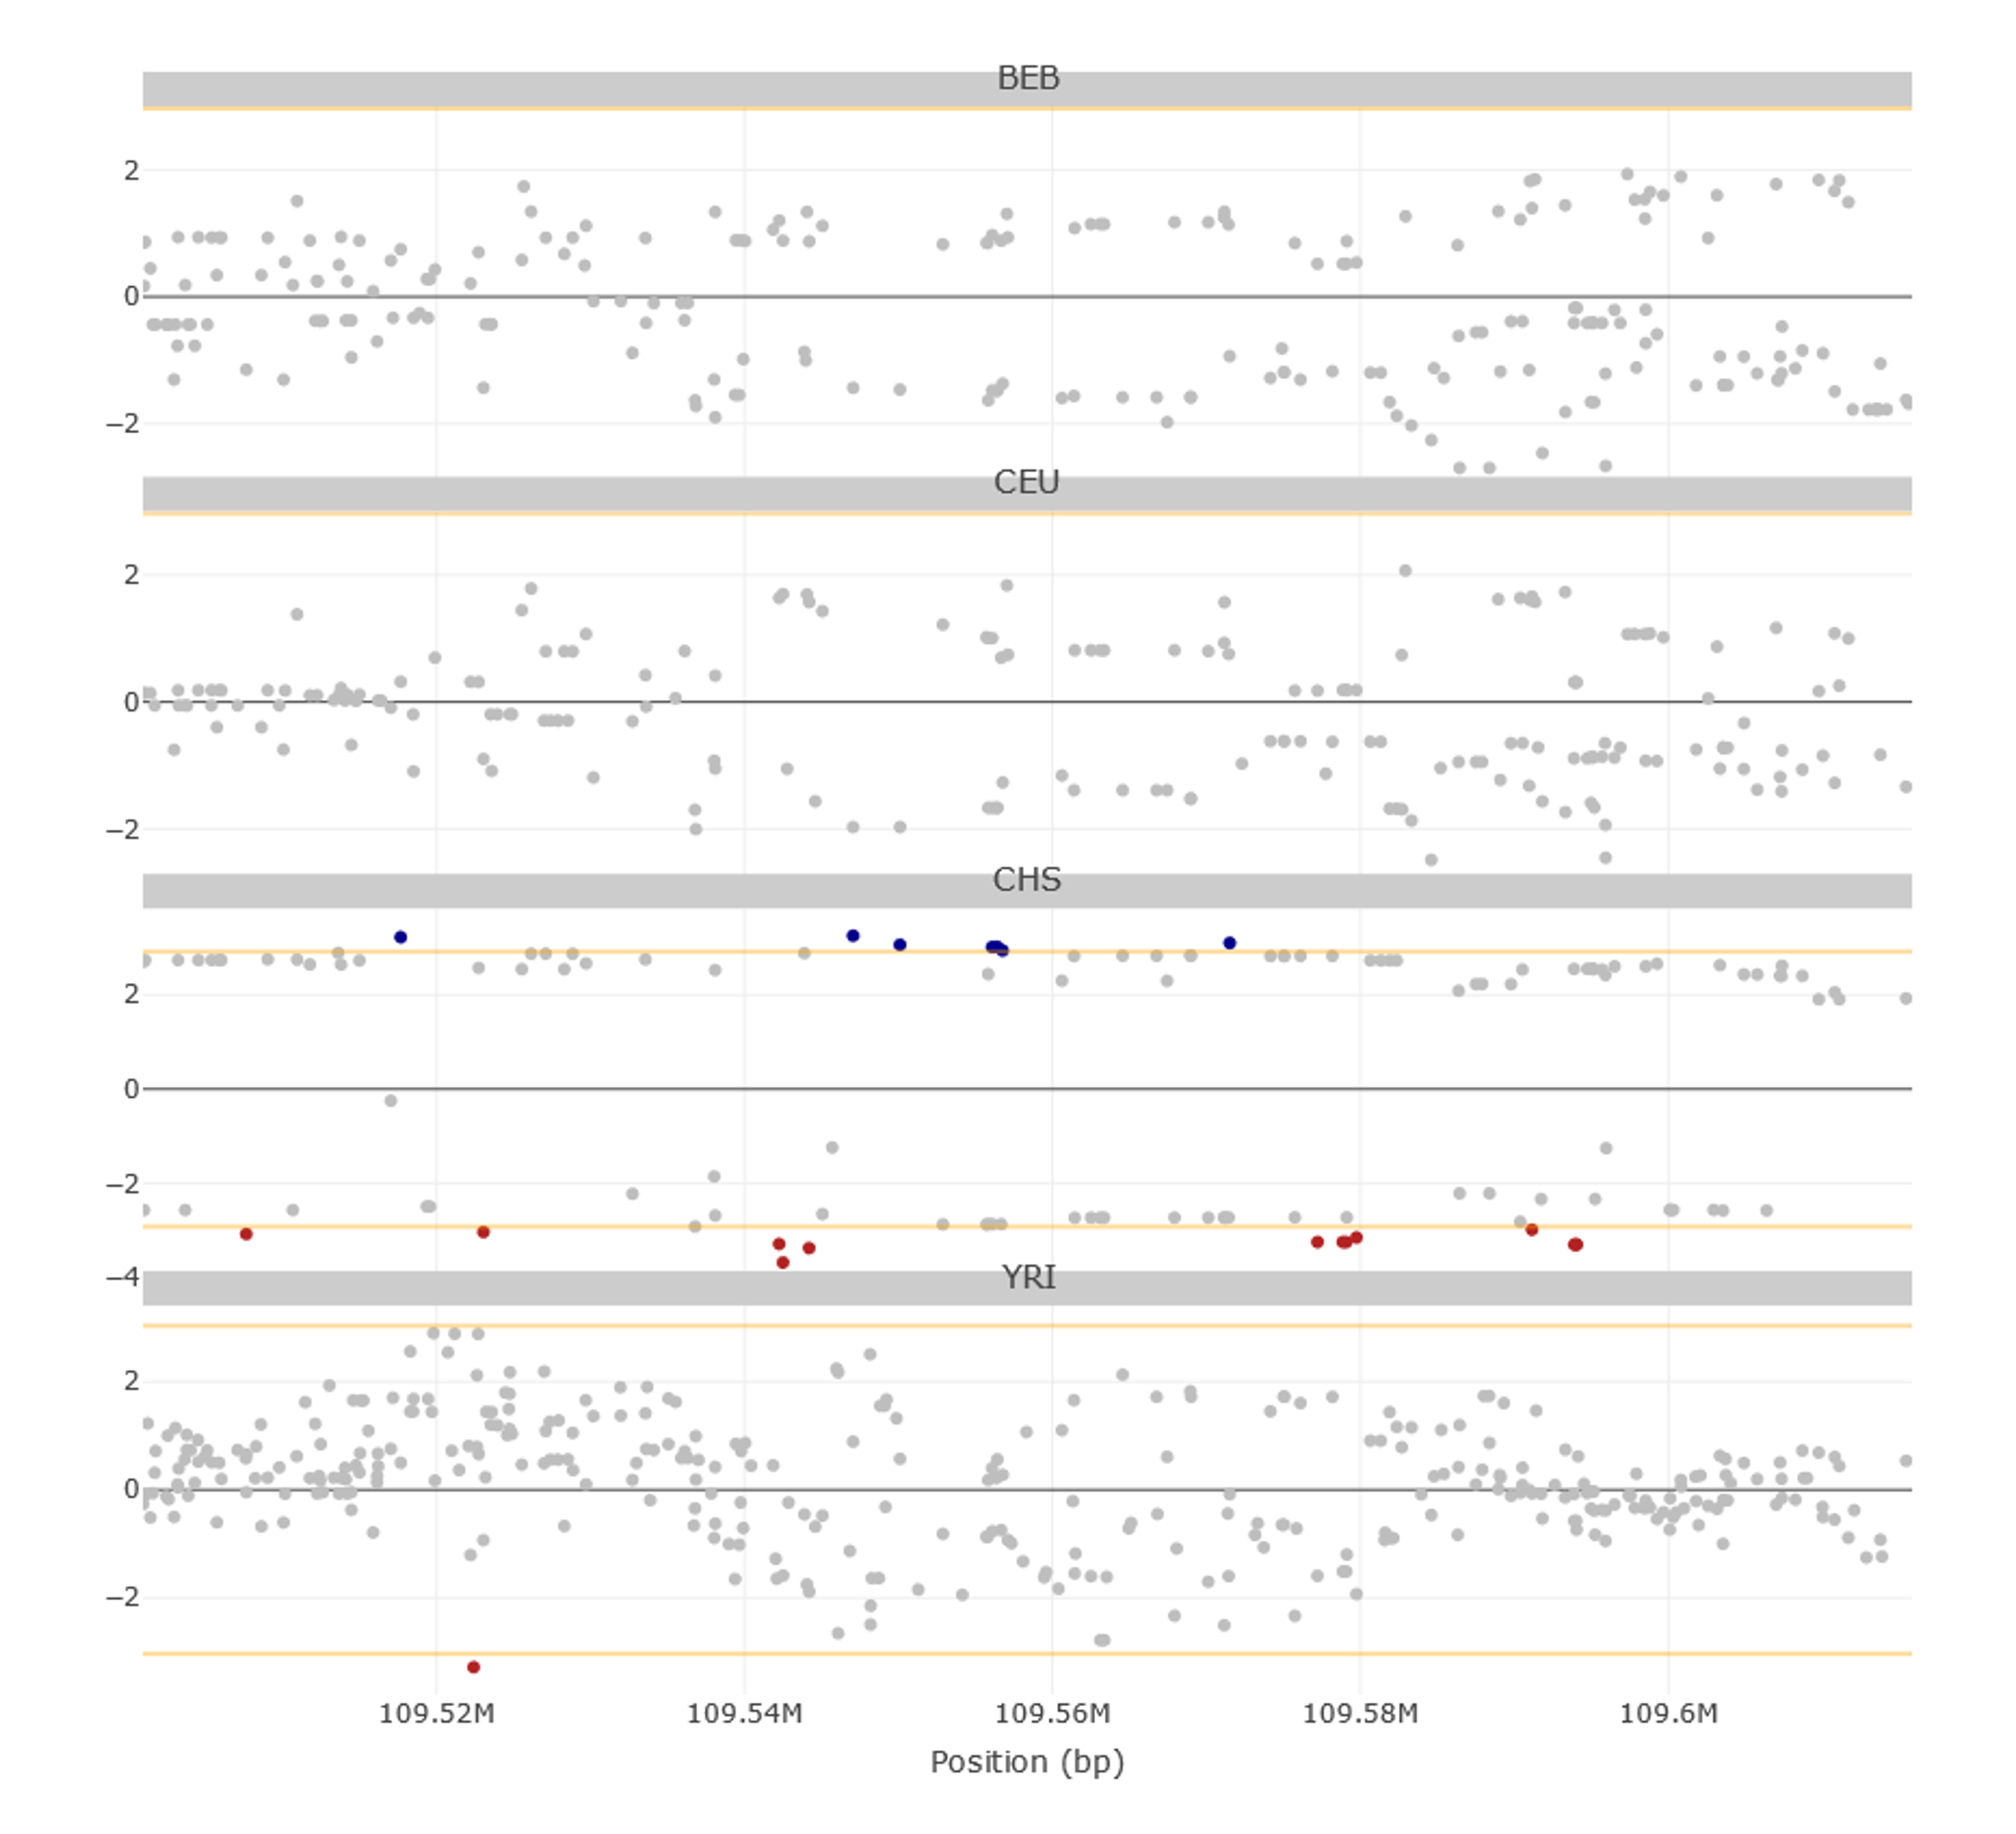
Figure 6 | iHS values for genetic variants along the EDAR locus region as shown in PopHumanVar. Extreme values (i.e., top 0.5%) of both iHS and nSL are highlighted (i.e., represented in blue or red).
Stats Visualization→ Favored Mutation (iSAFE)
AQUEST PARAGRAF S'HA D'ARREGLAR
The tab Stats Visualization→ Favored Mutation (iSAFE)— displays the distribution of iSAFE in all selected populations. Please note that only variants reporting an iSAFE score higher than 0.05 are shown by default to keep information manageable. Variants with extreme iSAFE values (i.e., top 0.01%) can be highlighted from the FILTERS MENU → Favored Mutation (iSAFE) on the left-side menu (remember to press the Update button to apply filters). In the current region of interest, extreme iSAFE values are almost exclusive to East-Asians (Figure 9).
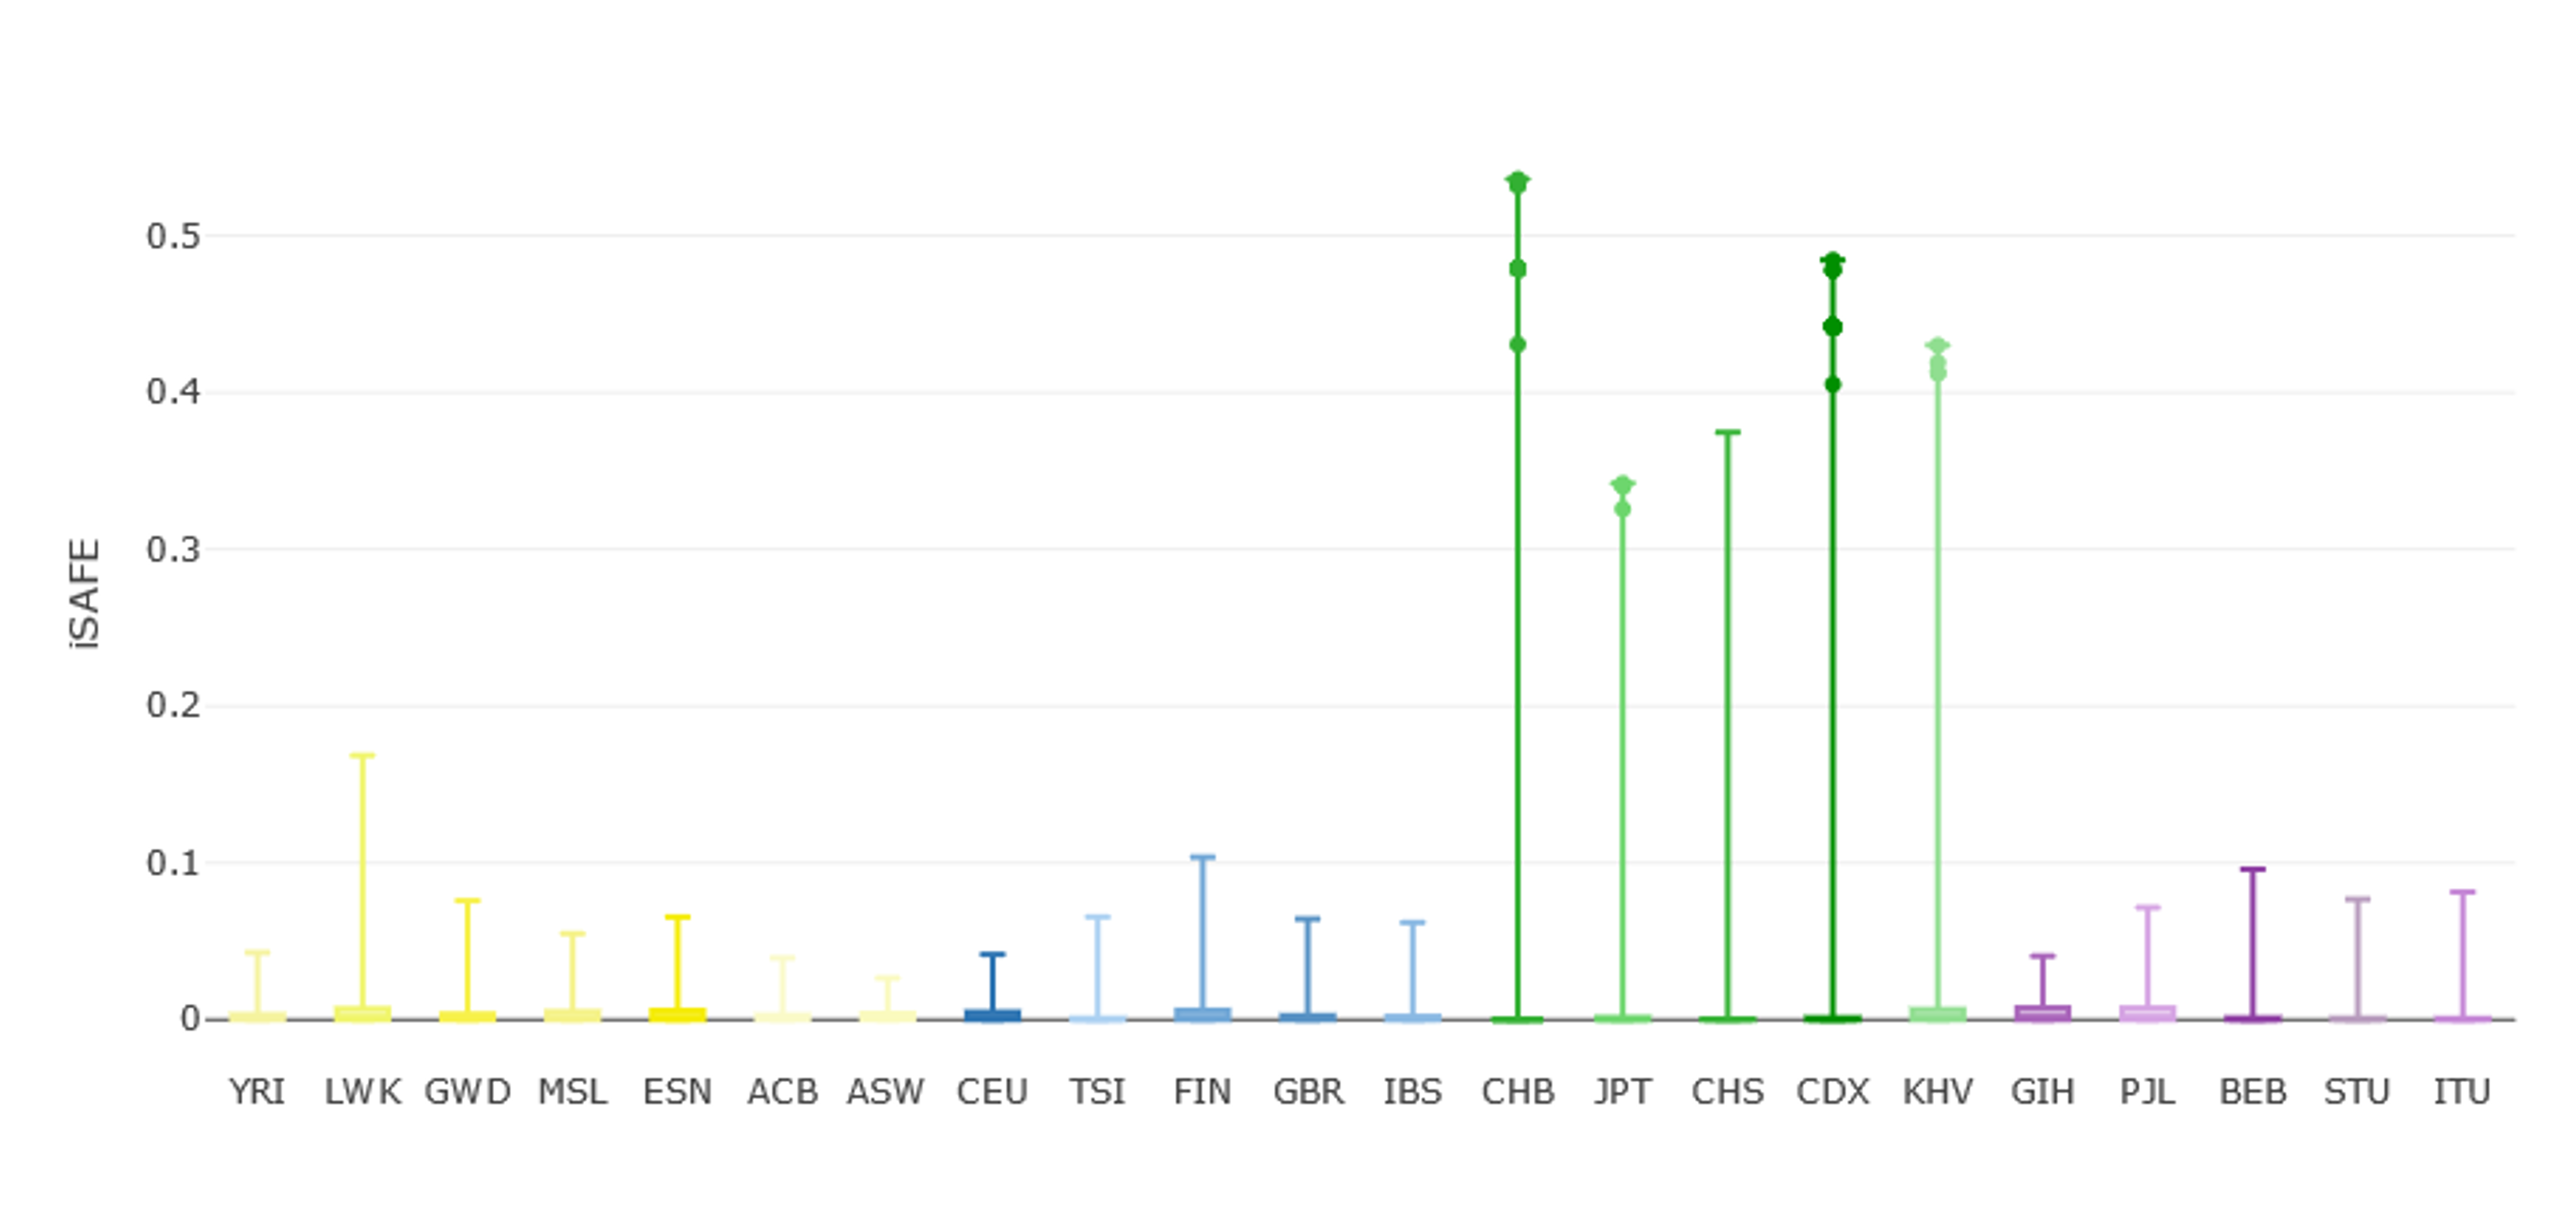
Figure 7 | iSAFE values for genetic variants along the EDAR gene region as shown in PopHumanVar. Extreme iSAFE values (i.e., top 0.01%) are those over the threshold line.
Stats Visualization→ Functional Description
The second tab Stats Visualization→ Functional Description— characterize genetic variants in the region according to several functional annotations. For instance, by having a glimpse into the different graphs in this tab, we first notice that there are no variants reporting a high impact effect according to SnpEFF and that the most extreme effect in this region is due to several missense variants, which are categorized as moderate impact (Figure 7a). Second, 24 variants report a RegulomeDB rank score of 2, meaning that there is no evidence of eQTLs supporting the regulatory potential of the variants in this region, although they do include transcription factor binding sites (Figure 7b). Third, even though most of the variants in the region are either benign or of uncertain significance according to ClinVar, 17 of them are pathogenic variants, and some others might also have clinically-relevant effects (Figure 7c). Fourth, there is a genetic variant reported 17 times in GWAS studies (rs3827760), and several others have been reported once, according to the GWAS catalog (Figure 7d). In addition, traits associated with variants in this region are related to blood protein levels, lung function, beard thickness, and hair color and shape, among others. Finally, 16 genetic variants in this region are reported in DisGeNET, all with the highest index of disease association (meaning that they only contribute to one specific disease —ectodermal dysplasia—) (Figure 7e). Please note that genetic variants can be filtered from the FILTERS MENU→ Functional Description on the left-side menu (remember to press the Update button to apply filters).
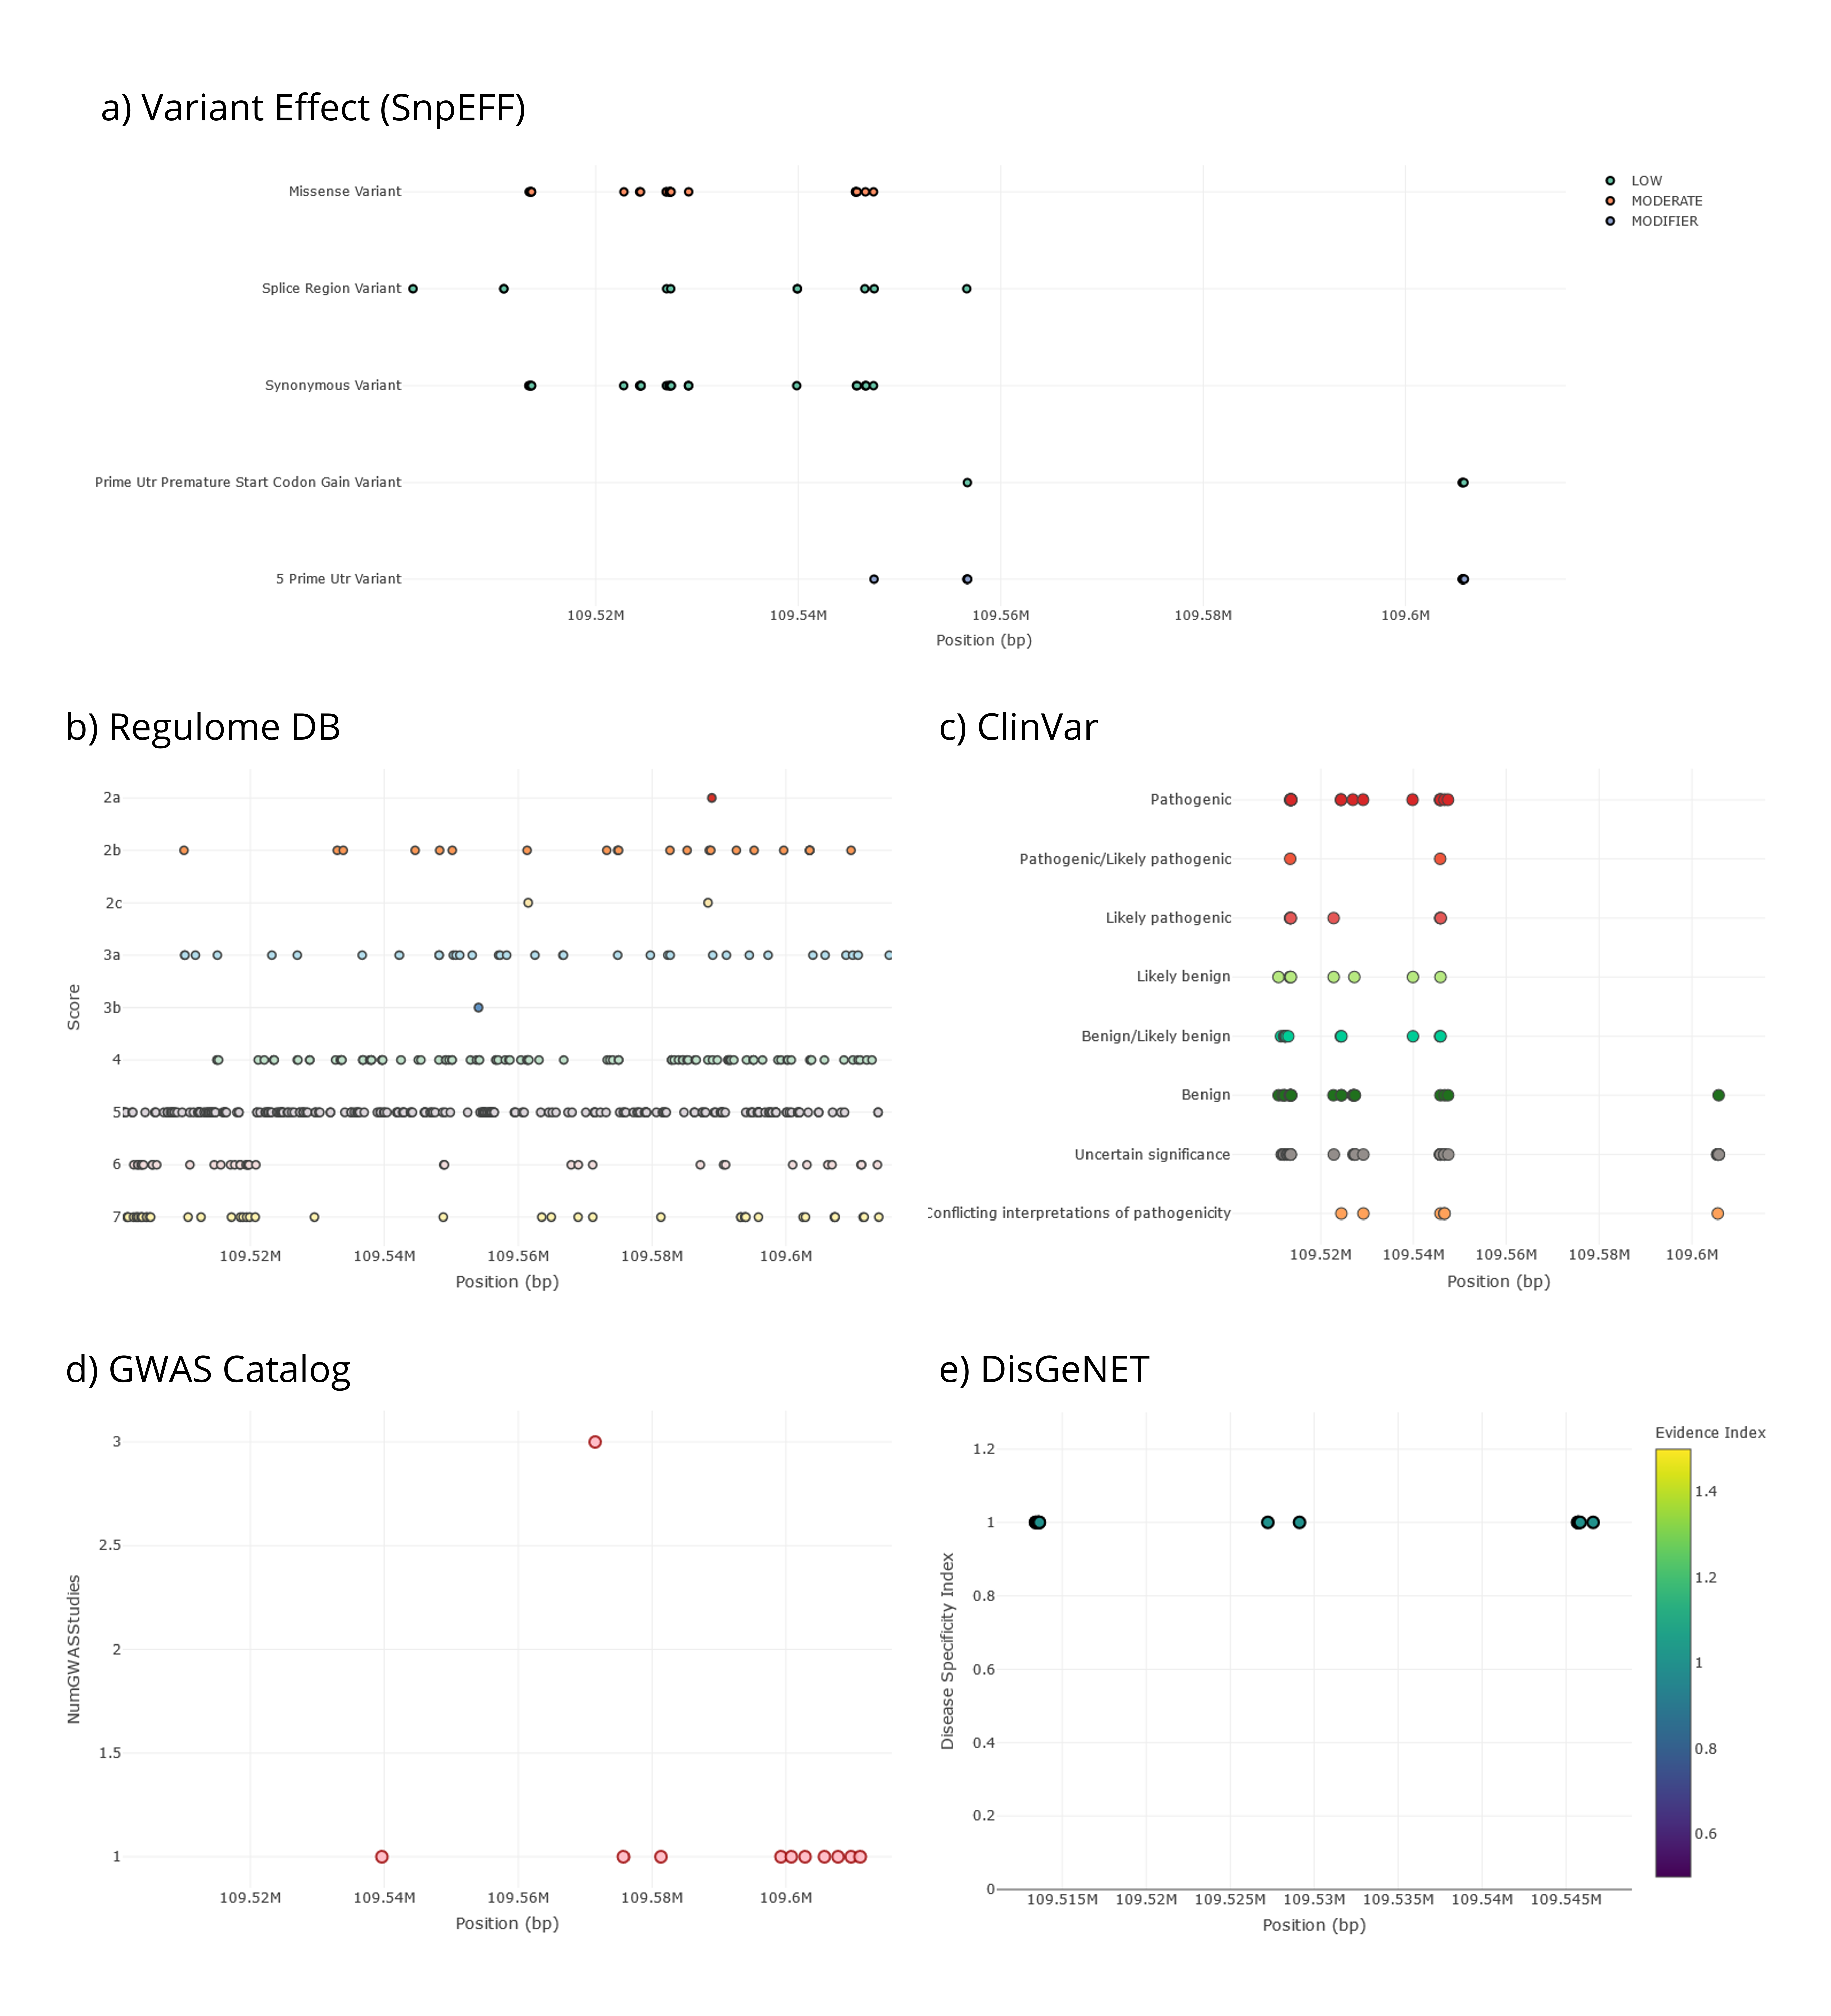
Figure 8 | Functional characterization of genetic variants in the EDAR gene region as shown in PopHumanVar.
Stats Visualization→ Age Information
The tab Stats Visualization→ Age Information— displays the estimated age of the genetic variants in the region, according to the Atlas of Variant Age (Figure 8). Filtering options can be accessed from the FILTERS MENU→ Age Information on the left-side menu and are especially relevant, as variants can be narrowed to a certain period or filtered by quality score, among others. Please note that some filters are applied by default to keep information manageable, so not all genetic variants are displayed in the default view. Remember to press the Update button to apply filters.
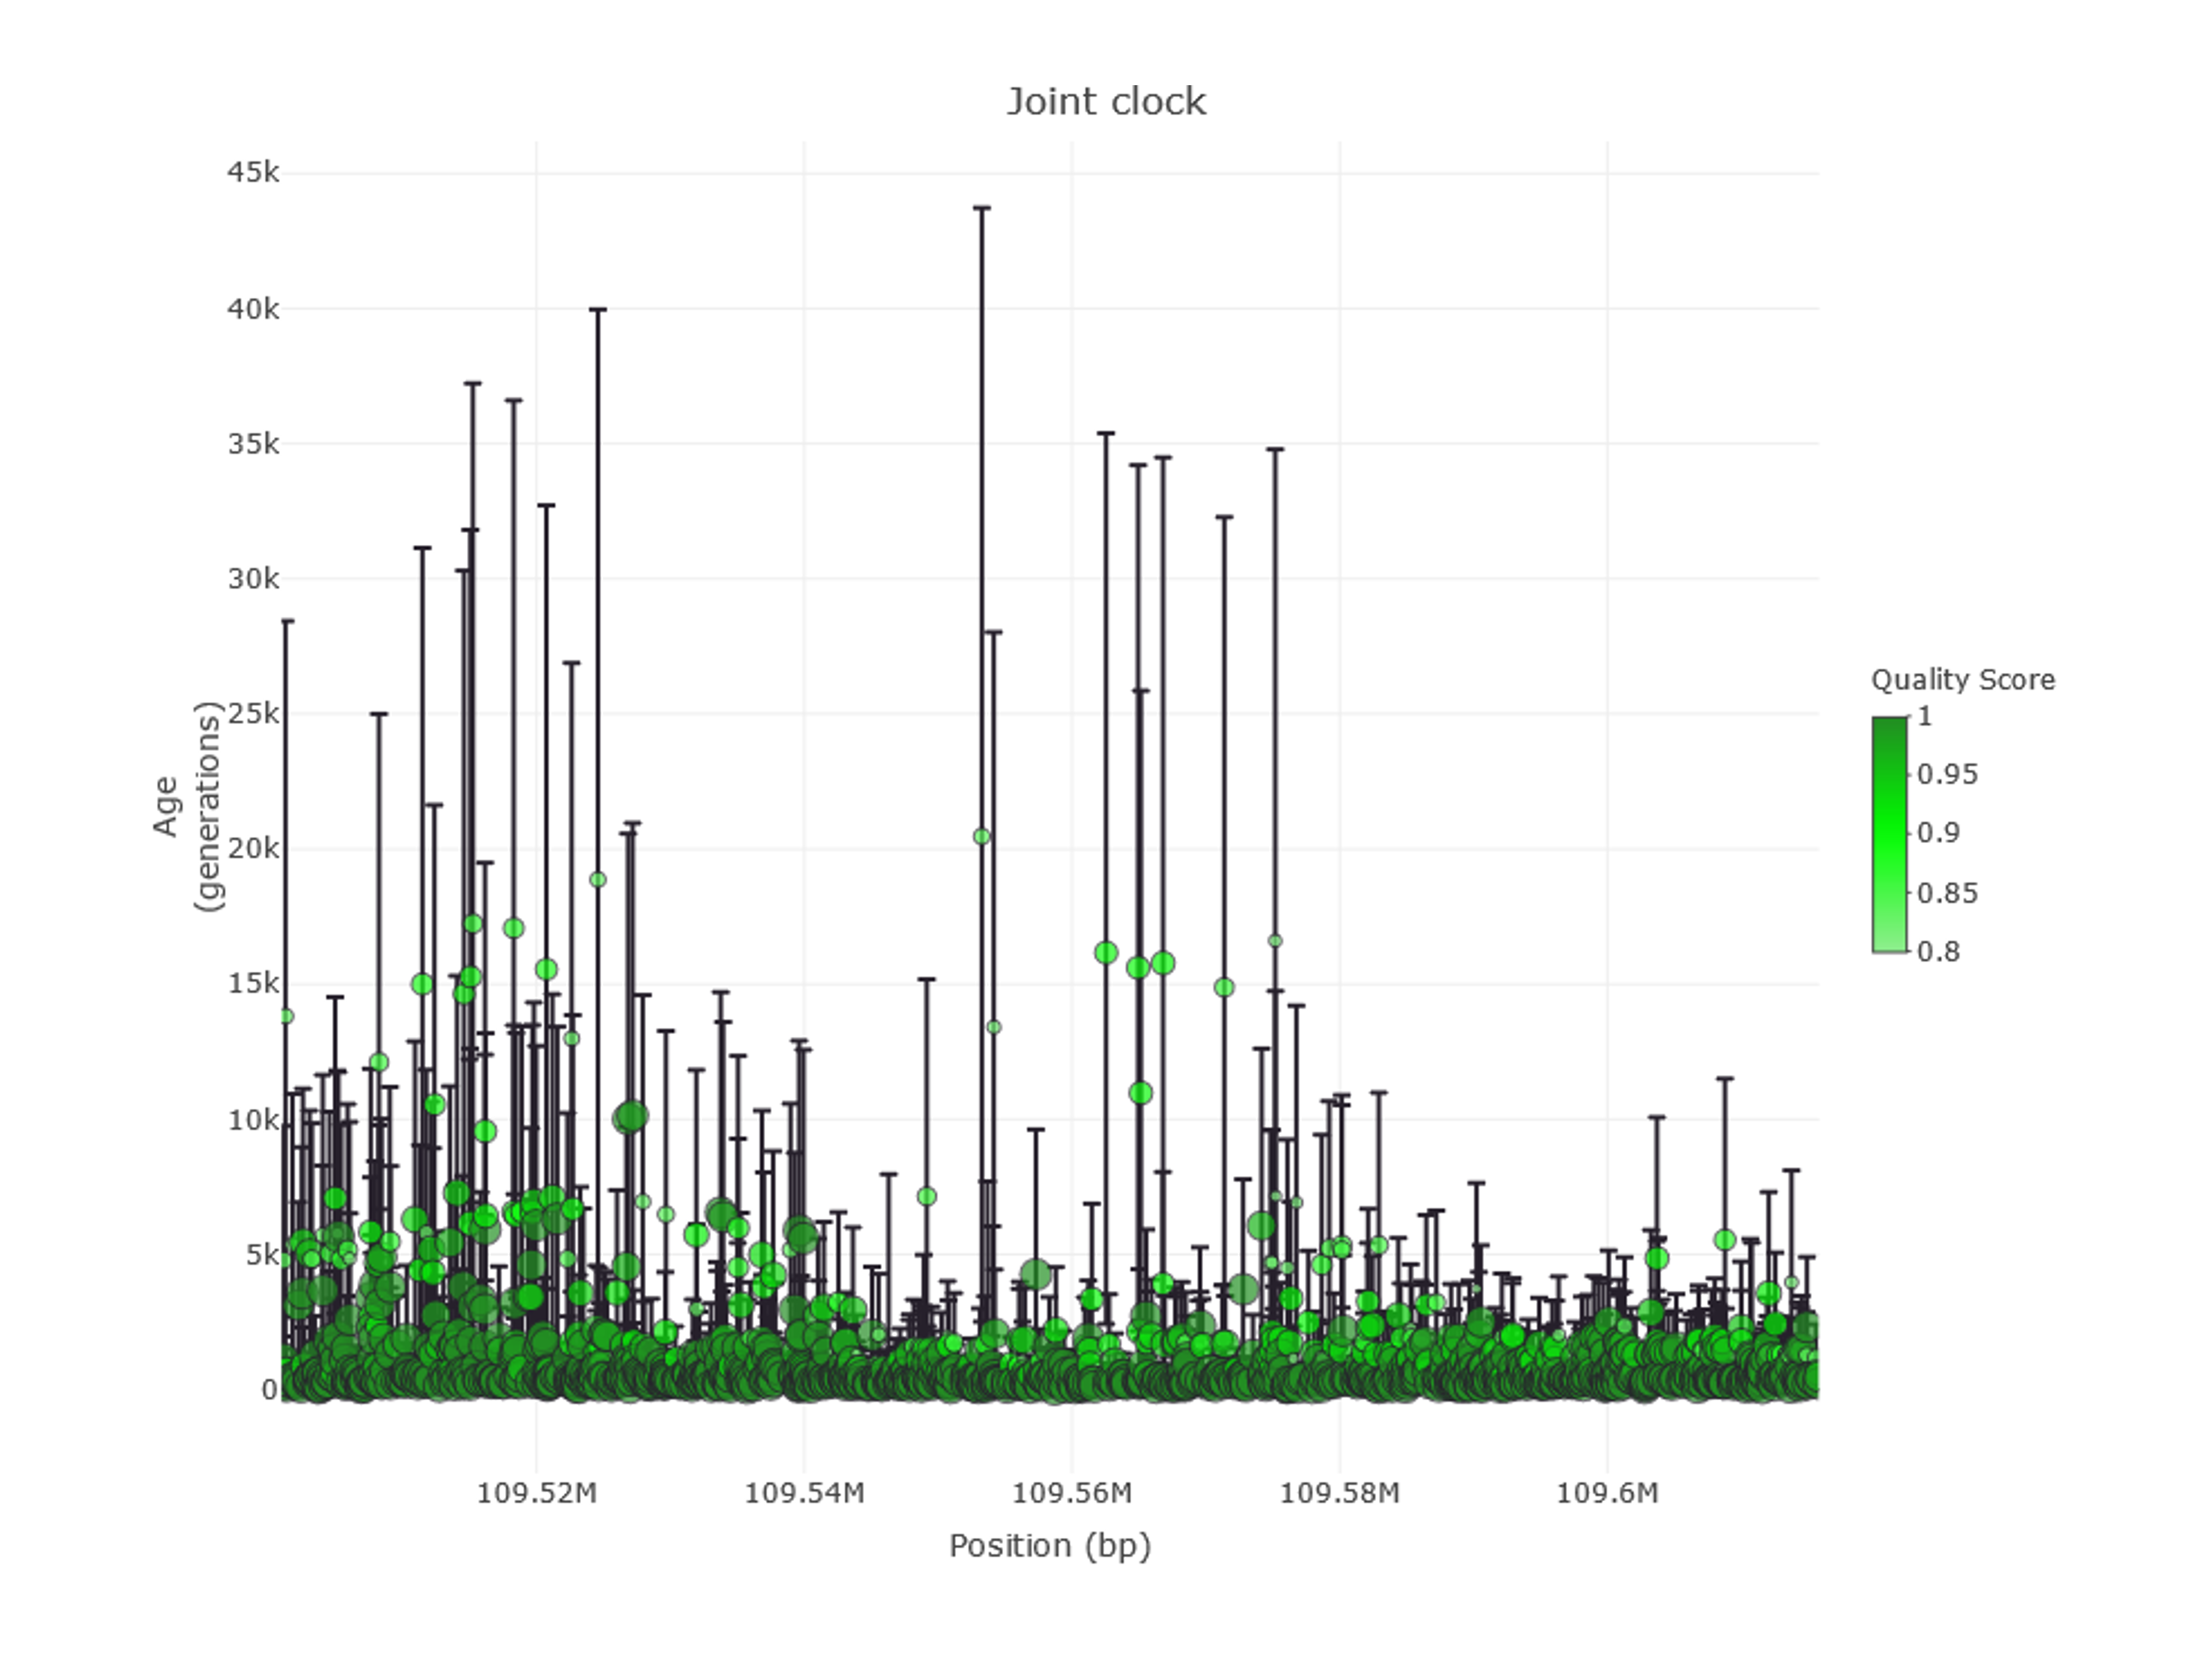
Figure 9 | Age information of genetic variants in the EDAR gene region as shown in PopHumanVar.
Stats Visualization→ Summary Report
The last tab Stats Visualization→ Summary Report— wraps together all the information into one single graph and a set of summary cards (Figure 10). The plot represents iSAFE scores (y-axis) for all variants along the region of interest (x-axis). The highest SnpEFF effect of each variant is displayed (color, see legend), as well as its combined iHS + nSL value (size). The rest of the information is displayed in the hoover, accessible by dragging the mouse around the plot. Cards summarize the most relevant information of each dataset. In both the plot and the summary cards, data is displayed for one specific population (which can be selected in the additional right-side menu in this tab —PLOT FILTERS—; remember to press the Refresh button to apply).
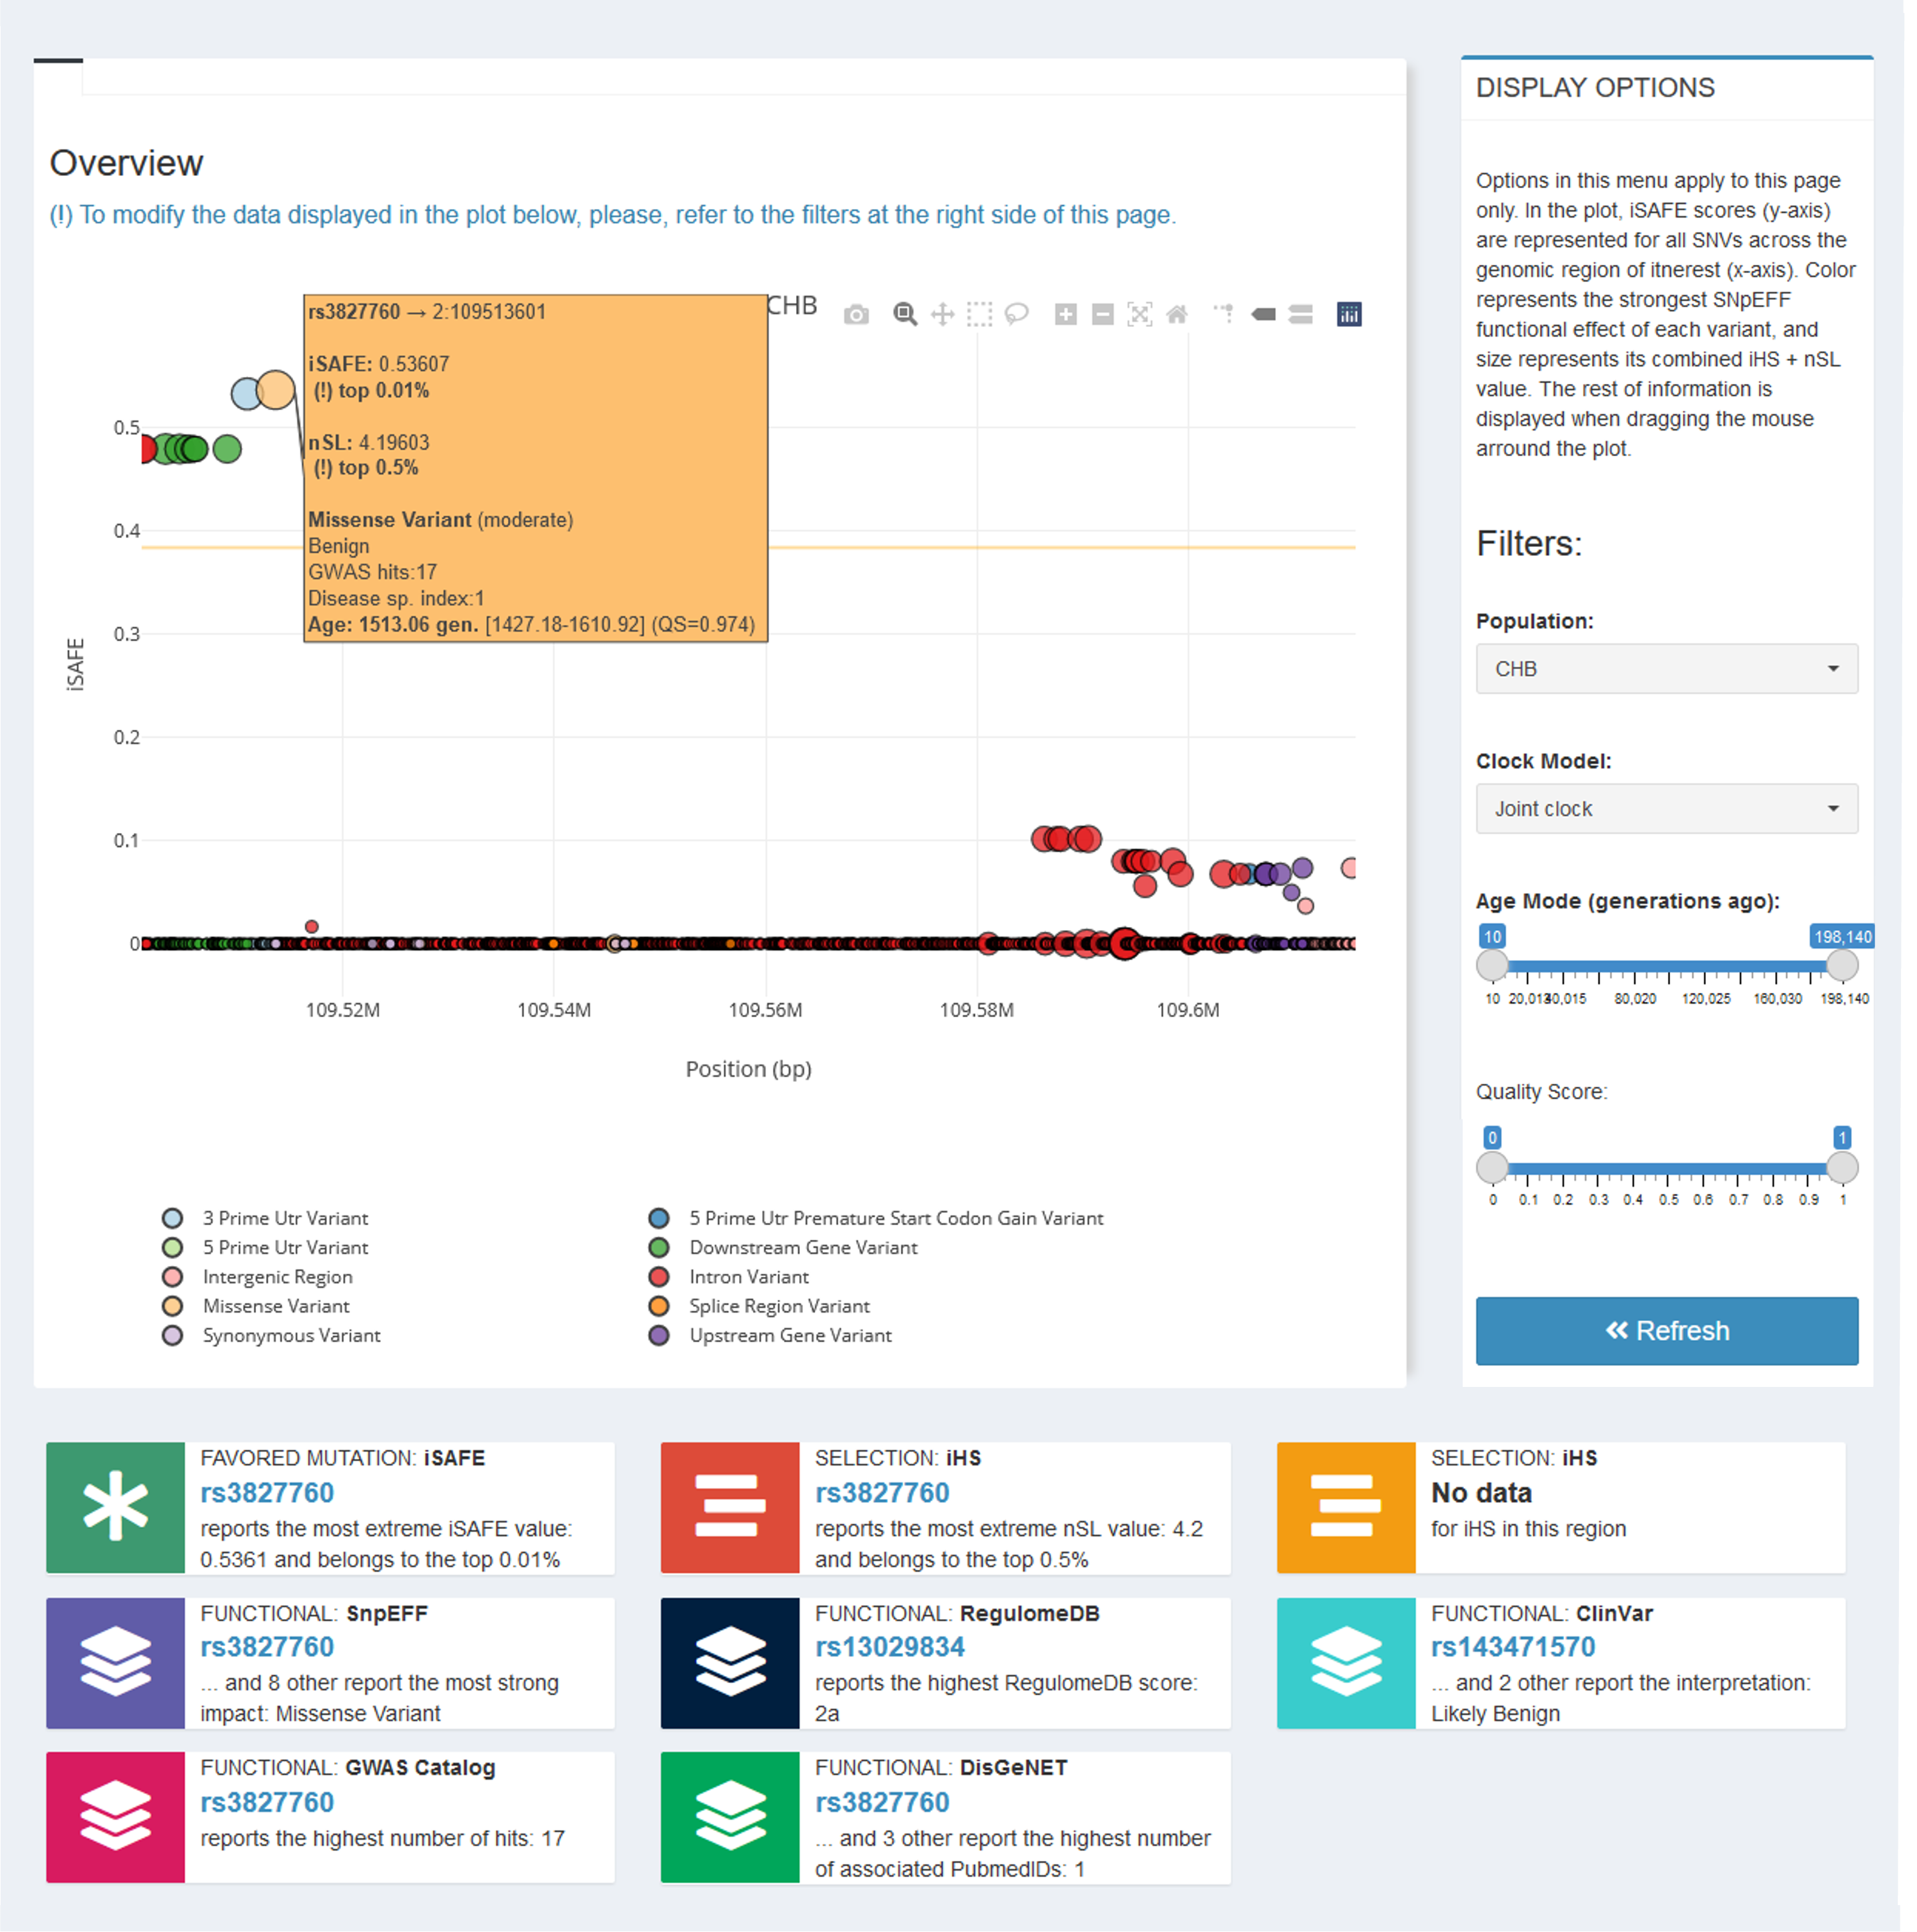
Figure 10 | Characterization and prioritization summary report of genetic variants in the EDAR gene region for the CHB population, as shown in PopHumanVar.
3. Downloading raw data
To download raw data, click Download from the left-side menu. You can either download specific data from the region of interest (Download→ Current Region), or batch download all the data from PopHumanVar given one or more sets of coordinates (Download→ Batch Download). In the first case, you need to specify the exact data you want to retrieve by using the right-side menu of this tab (remember to press the Refresh button to apply).
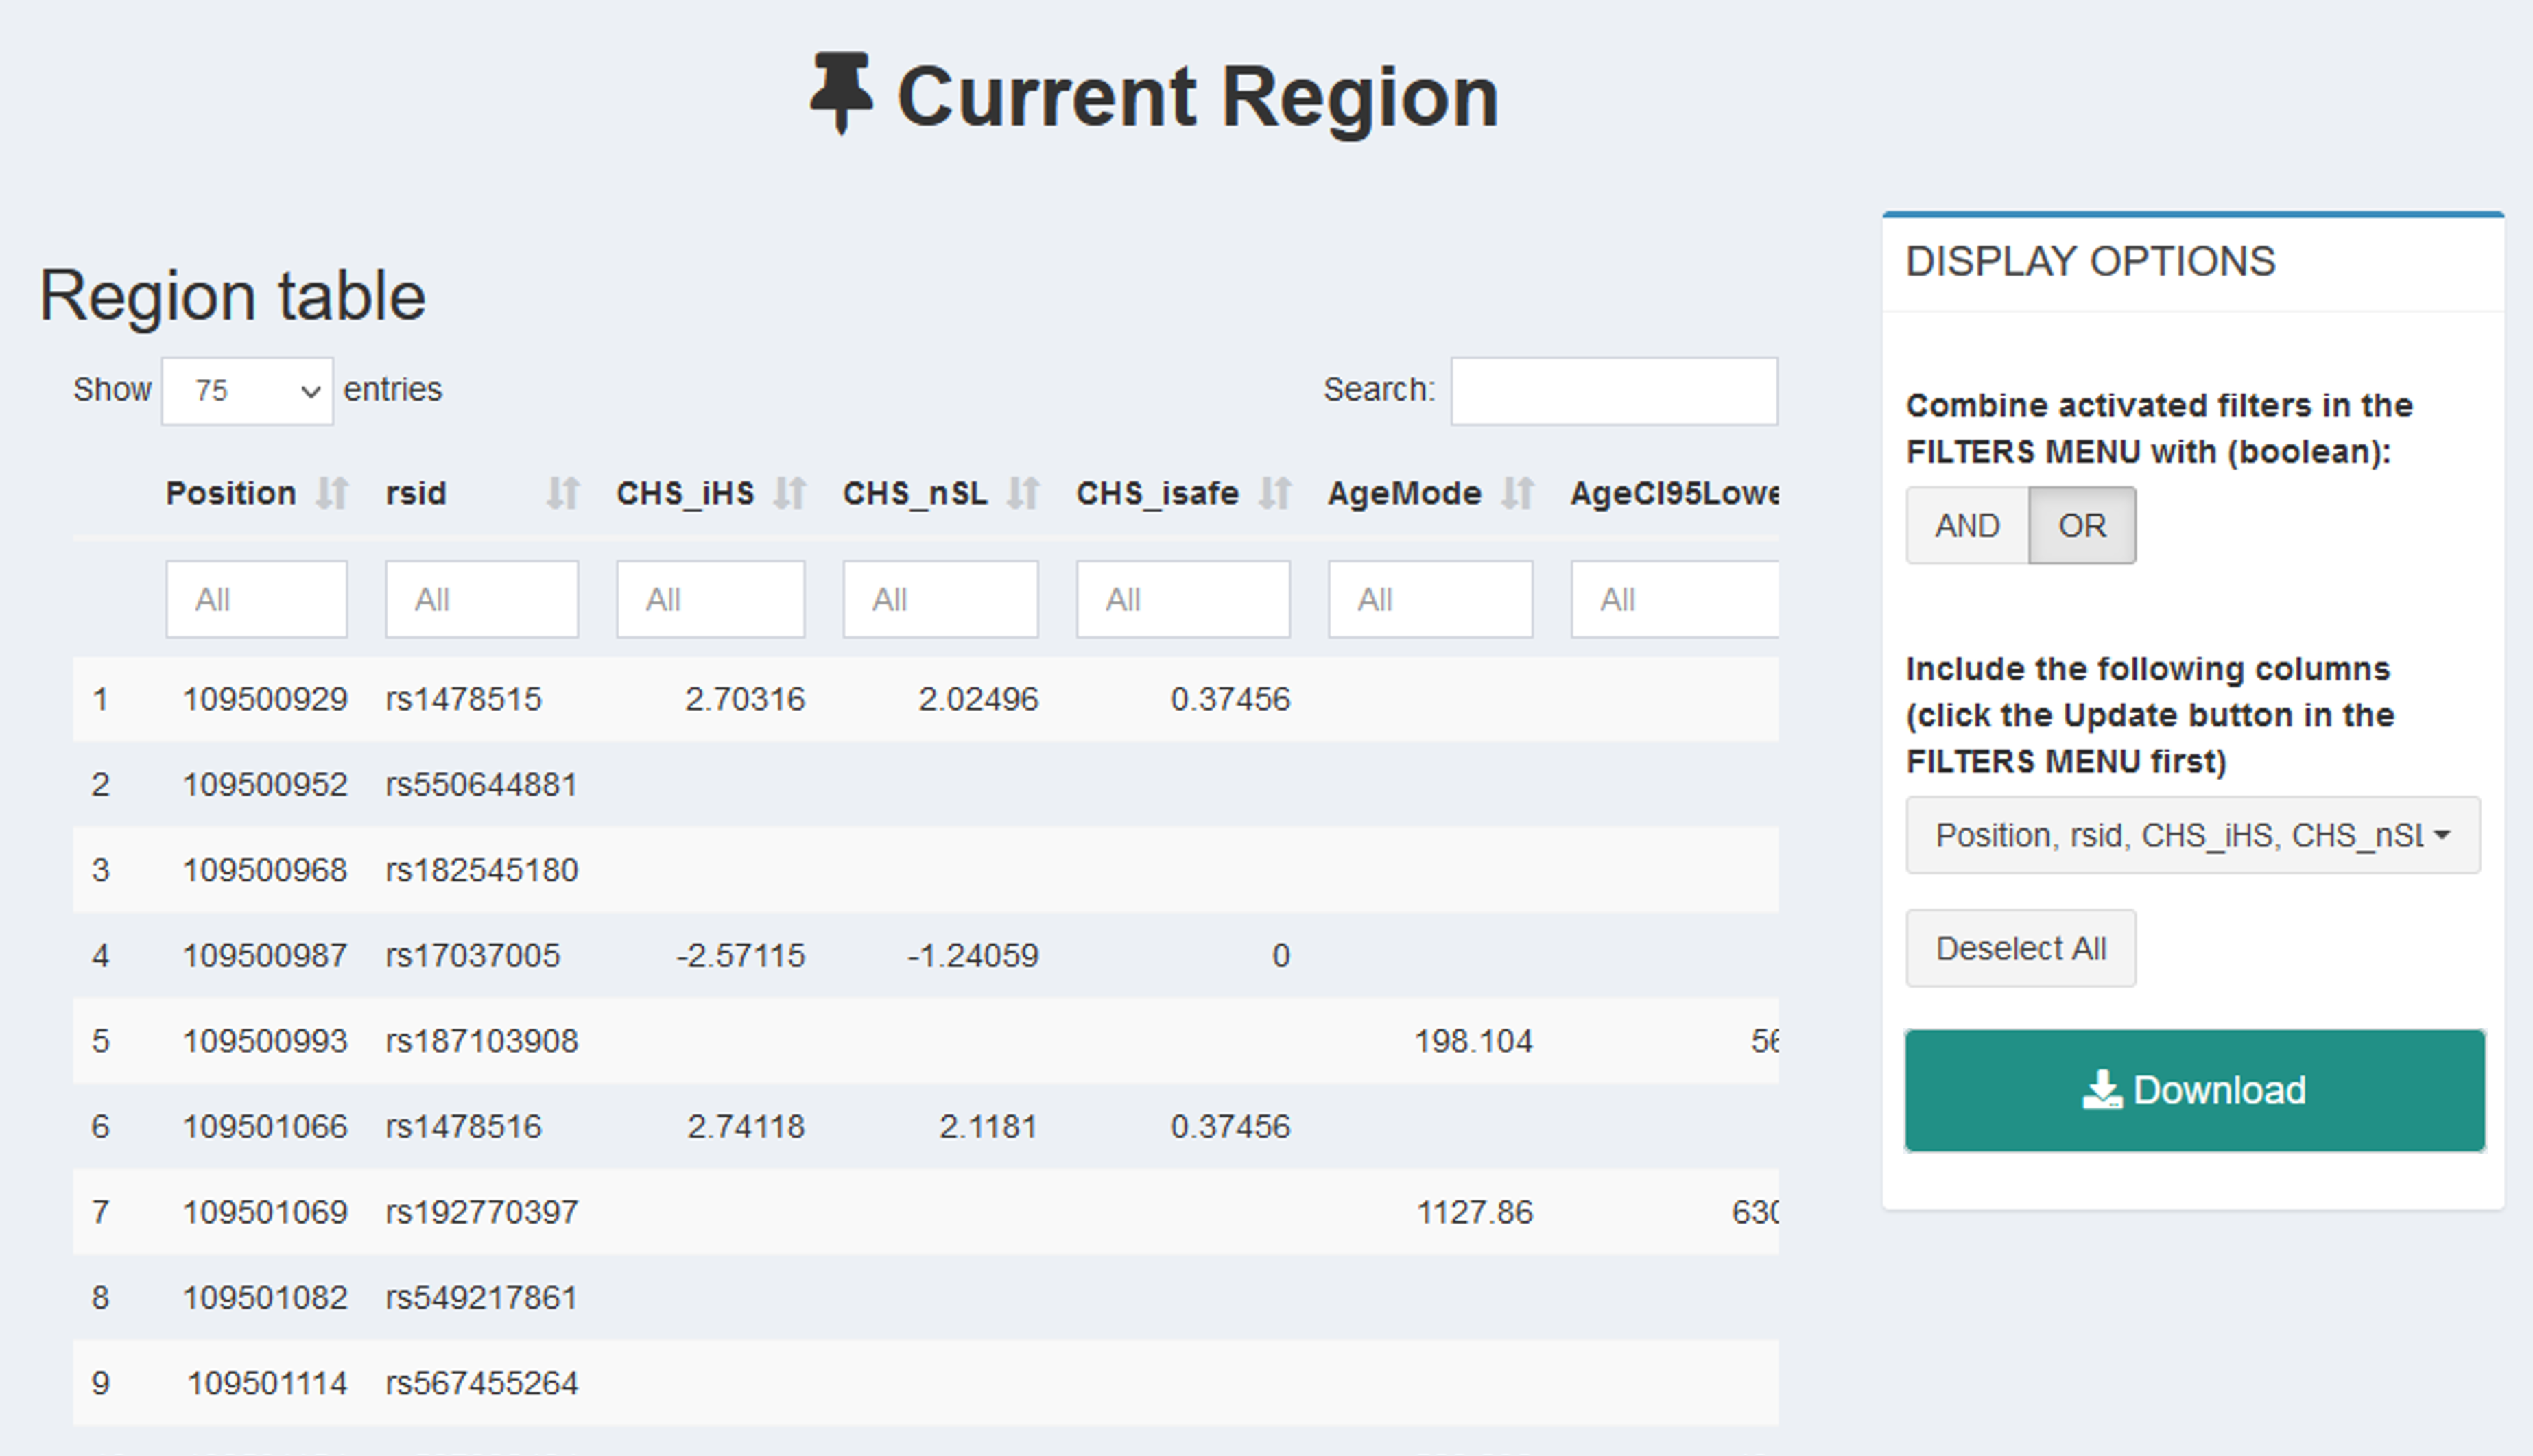
Figure 11 | Download raw data in PopHumanVar.
Section 3| Uploading your own data
To upload your own data, click Upload data. This tab allows uploading a VCF file with custom data, that will be processed automatically by the PopHumanVar pipeline. The results will be sent to the user by email as a dynamic Shiny markdown file.
1. File requirments
The uploaded file must fulfill the following conditions:
- Phased VCF file: if the two genotypes are separated by a pipe (e.g. 0|1) it means that they are phased; if they are separated by a slash (e.g. 0/1), they are unphased. If so, refer to any phasing tools to adress this - SHAPEIT, Eagle, Beagle, etc.
- Up to 2 Mbp of genomic sequence
- Individuals from one population. This condition will be assumed but not checked by our pipeline.
- The reference/alternative alleles should match the ancestral/derived alleles respectively. Both selscan and iSAFE are 'dumb' with respect to ancestral/derived coding and simply assume that the reference allele (REF) is the ancestral allele. With previous knowledge of the ancestral alleles PLINK provides the tools to recode vcf.
2. Parameters
Once the uploaded file is validated for the conditions detailed in the section above, an additional panel appears (it might take up to a minute). Using this panel, the user can choose which filters and computation parameters to apply to their data. The ones marked by default are the ones that used to generate PopHumanVar data.
Here you can find a summary of those options. For more information, pleas read the manuals of both programs (links provided below).
Selscan:
Check the manual for more information.
- --map: refers to the Recombination Map that will be used for iHS coputation. You can either choose:
- Bherer et al., [6], the one we used for PopHumanVar
- Set the --pmap flag to use physical distances instead of genetic distances. When activated, --map is not required.
- Upload your own Recombination Map. If you intend to use this option, please, make sure that the provided Recombination Map fulfills Selscan requirments.
- --cutoff: to set the EHH decay stopping condition. When computing iHS, the EHH decay curve is truncated and integrated once the EHH decay cutoff is reached. When computing nSL,. DEFAULT: 0.05.
- --maf: to set a minor allele frequency (MAF) threshold. Any site below this will not be used as a core site for iHS and nSL scans. DEFAULT: 0.05.
- --max-gap: (numeric) use it to set the maximum allowed gap between loci when assembling haplotypes for iHS and nSL computations. If a gap greater than this is encountered before a stop condition is reached, the computation at the current core locus is aborted. DEFAULT: 200000.
- --gap-scale: (numeric) use it to set the gap scale parameter (from Voight et al., 2006[2]). When computing iHS if a gap of B bp is encountered and is greater than GAP SCALE, then the distance function g(xi, xj) is weighted by GAP SCALE/B. DEFAULT: 20000.
- --max-extend: (numeric) use it to set an additional stopping condition that only applies for iHS computations. If the EHH decay curve has extended MAX EXTEND bp away from the core without reaching the ehh decay cutoff, truncate the curve here and integrate. Set <=0 for no restriction. DEFAULT 1000000.
- --max-extend-nsl: (numeric) use it to set a stopping condition that only applies for nSL computation. If the EHH decay curve has extended MAX EXTEND loci away from the core, truncate the curve here and integrate. Set <=0 for no restriction. DEFAUT 100.
- --trunc-ok : (boolean) core loci near the boundaries of the data set are unlikely to reach a stopping condition before running out of haplotype information. Typically in this case, EHH curves are truncated and thrown out. Set --trunc-ok to integrate these anyway.
- --alt : (boolean) set --alt to compute EHH using sample haplotype frequencies
- --keep-low-freq: if you wish to include low frequency sites. This flag only applies for iHS computation. DEFAULT: --skip-low-freq.
iSAFE
Check the manual for more information.
- --AA: refers to the Ancestral Allele file in FASTA (.fa) format. We highly recomend to work with one, but you can use any of the following options:
- Using the Ancestral Allele file from GRCh37/hg19. These are the ones we used for PopHumanVar.
- Work without an Ancestral Allele file. If so, the program raises a warning and assumes reference allele (REF) is ancestral allele (See Requirments Section above).
- Upload your own Ancestral Allele fasta file.
- Gap treatment::
- --MaxGapSize: Maximum gap size in bp. When there is a gap larger than --MaxGapSize the program raise an error. DEFAULT: 10000.
- --IgnoreGaps: to ignore the previous parameter. Gaps will not raise any error in the program.
- --window: Sliding window size in polymorphic sites. DEFAULT 300.
- --step: Step size of sliding window in polymorphic sites. DEFAULT 150.
- --topk: Rank of SNPs used for learning window weights (alpha). DEFAULT 1.
- --MaxRank: Ignore SNPs with rank higher than MAXRANK. For considering all SNPs set --MaxRank > --window. The higher the --MaxRank, the higher the computation time. DEFAULT 15.
- --MaxFreq: Ignore SNPs with frequency higher than MaxFreq. DEFAULT 0.95.
3. Results
When the pipeline process is complete, the results will be sent to the users email. That is, a compressed directory containing a raw .txt file with the computed data aside from a shiny markdown file representing a simplified version of PopHumanVar.
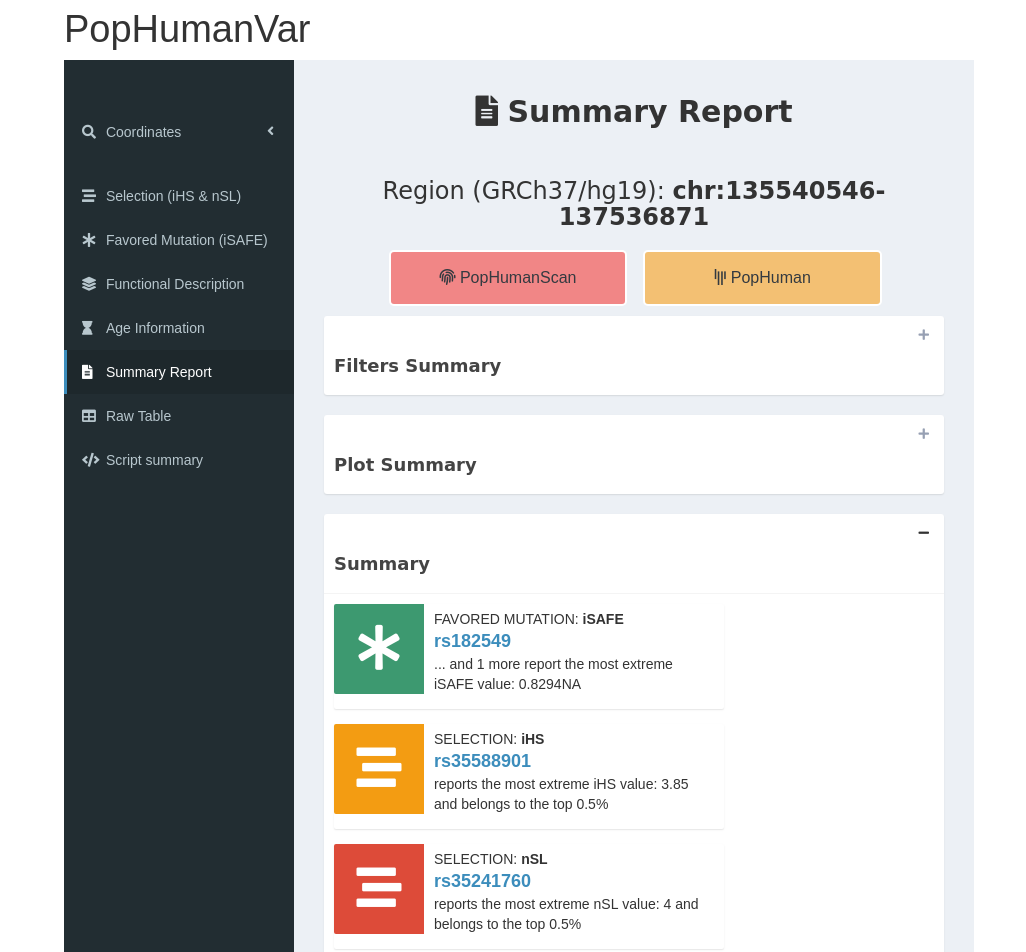
Figure 12 | Overview of the results file.
References
1. The 1000 Genomes Project Consortium. (2015). A global reference for human genetic variation. Nature, 526(7571), 68-74
2. Voight, B. F., Kudaravalli, S., Wen, X., & Pritchard, J. K. (2006). A map of recent positive selection in the human genome. PLoS Biol, 4(3), e72
3. Ferrer-Admetlla, A., Liang, M., Korneliussen, T., & Nielsen, R. (2014). On detecting incomplete soft or hard selective sweeps using haplotype structure. Molecular biology and evolution, 31(5), 1275-1291.
4. Akbari, A., Vitti, J. J., Iranmehr, A., Bakhtiari, M., Sabeti, P. C., Mirarab, S., and Bafna, V. (2018). Identifying the favored mutation in a positive selective sweep. Nature methods, 15(4), 279.
5.Gazal, S., Sahbatou, M., Babron, M. C., Génin, E., & Leutenegger, A. L. (2015). High level of inbreeding in final phase of 1000 Genomes Project. Scientific reports, 5(1), 1-7.
6. Szpiech, Z. A., & Hernandez, R. D. (2014). selscan: an efficient multithreaded program to perform EHH-based scans for positive selection. Molecular biology and evolution, 31(10), 2824-2827.
7. Bhérer, C., Campbell, C. L., and Auton, A. (2017). Refined genetic maps reveal sexual dimorphism in human meiotic recombination at multiple scales. Nature communications, 8(1), 1-9.
8. Cingolani, P., Platts, A., Wang, L. L., Coon, M., Nguyen, T., Wang, L., ... & Ruden, D. M. (2012). A program for annotating and predicting the effects of single nucleotide polymorphisms, SnpEff: SNPs in the genome of Drosophila melanogaster strain w1118; iso-2; iso-3. Fly, 6(2), 80-92.
9. Boyle, A. P., Hong, E. L., Hariharan, M., Cheng, Y., Schaub, M. A., Kasowski, M., ... & Snyder, M. (2012). Annotation of functional variation in personal genomes using RegulomeDB. Genome research, 22(9), 1790-1797.
10. Landrum, M. J., Lee, J. M., Riley, G. R., Jang, W., Rubinstein, W. S., Church, D. M., & Maglott, D. R. (2014). ClinVar: public archive of relationships among sequence variation and human phenotype. Nucleic acids research, 42(D1), D980-D985.
11. MacArthur, J., Bowler, E., Cerezo, M., Gil, L., Hall, P., Hastings, E., ... & Parkinson, H. (2017). The new NHGRI-EBI Catalog of published genome-wide association studies (GWAS Catalog). Nucleic acids research, 45(D1), D896-D901.
12. Piñero, J., Queralt-Rosinach, N., Bravo, A., Deu-Pons, J., Bauer-Mehren, A., Baron, M., ... & Furlong, L. I. (2015). DisGeNET: a discovery platform for the dynamical exploration of human diseases and their genes. Database, 2015.
13. Albers, P. K., & McVean, G. (2020). Dating genomic variants and shared ancestry in population-scale sequencing data. PLoS biology, 18(1), e3000586.
14. Kamberov, Y. G., Wang, S., Tan, J., Gerbault, P., Wark, A., Tan, L., ... & Sabeti, P. C. (2013). Modeling recent human evolution in mice by expression of a selected EDAR variant. Cell, 152(4), 691-702.
15. Murga-Moreno, J., Coronado-Zamora, M., Bodelón, A., Barbadilla, A., and Casillas, S. (2019). PopHumanScan: the online catalog of human genome adaptation. Nucleic acids research, 47(D1), D1080-D1089.
16. Casillas, S., Mulet, R., Villegas-Mirón, P., Hervas, S., Sanz, E., Velasco, D., ... and Barbadilla, A. (2018). PopHuman: the human population genomics browser. Nucleic acids research, 46(D1), D1003-D1010.
About Us
Contact
Any correspondence should be addressed to:
Aina Colomer i Vilaplana
Email:aina.colomer@uab.cat
Sònia Casillas
Email:sonia.casillas@uab.cat
Tel:+34 93 581 2730
Fax:+34 93 581 2011
Mailing adress
Bioinformatics for Genomics Diversity group
Department of Genetics and Microbiology
Universitat Autònoma de Barcelona
08193 Bellaterra, Barcelona Spain
Institut de Biotecnologia i de Biomedicina
Universitat Autònoma de Barcelona
08193 Bellaterra, Barcelona, Spain
Acknowledgments
The authors would like to thank Laia Carrillo for evaluating the PopHumanVar data on several case regions, Alejandro Arangua and Nerea Carron for testing the database implementation.
This work was supported by the Ministerio de Economía y Competitividad (Spain) and co-financed by ERDF funds [CGL2017-89160P to Mauro Santos, A.B.]; AGAUR (Generalitat de Catalunya) [2017SGR-1379 to Alfredo Ruiz]; Secretaria d’Universitats i Recerca de la Generalitat de Catalunya and the European Social Fund [2020FI_B-01045 to A.C.-V.]; and Departament de Genètica i de Microbiologia (UAB) [PIF to J.M.-M.]. Funding for open access charge: Ministerio de Economía y Competitividad (Spain).